

Question: PROBLEM #3 Objective This prosract oFthe problem set is designed to improve your understanding of cost behavior and the use of cost-volume- (CVP) analysis. Cost
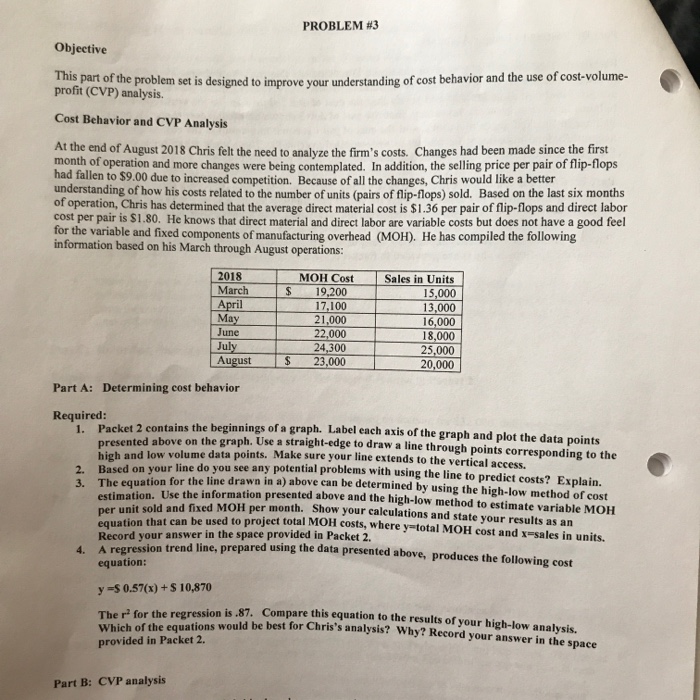
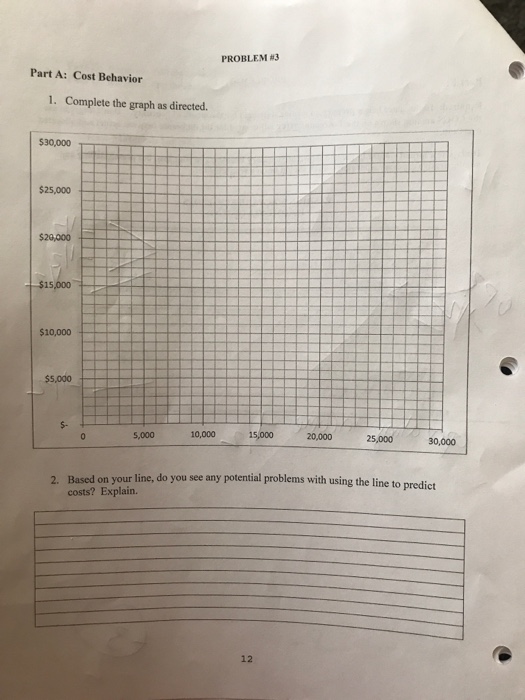
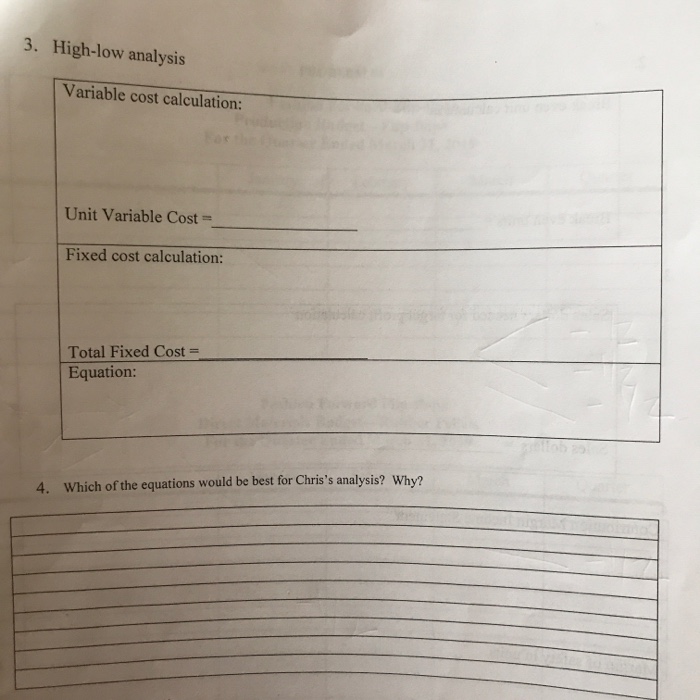
PROBLEM #3 Objective This prosract oFthe problem set is designed to improve your understanding of cost behavior and the use of cost-volume- (CVP) analysis. Cost Behavior and CVP Analysis At the end of August 2018 Chris felt the need to analyze the firm's costs. Changes had been made since the first month of operation and more changes were being contemplated. In addition, the selling price per pair of flip-flops had fallen to $9.00 due to increased competition. Because of all the changes, Chris would like a better understanding of how his costs related to the number of units (pairs of flip-flops) sold. Based on the last six months of operation, Chris has determined that the average direct material cost is $1.36 per pair of flip-flops and direct labor cost per pair is $1.80. He knows that direct material and direct labor are variable costs but does not have a good feel for the variable and fixed components of manufacturing overhead (MOH). He has compiled the following information based on his March through August operations: 2018 March MOH Cost Ma June Jul August 23,000 17,100 21,000 22,000 24 Sales in Units 15,000 13,000 16,000 18,000 25,000 20,000 Part A: Determining cost behavior Required 1. Packet 2 contains the beginnings of a graph. Label each axis of the graph and plot the data points above on the graph. Use a straight-edge to draw a line through points corresponding to the presented high and low Based o volume data points. Make sure your line extends to the vertical access. n. Use the information presented above and the high-low method to estimate variable MOH hat can be used to project total MOH costs, where y-total MOH cost and x-sales in units. n your line do you see any potential problems with using the line to predict costs? Explain. cuation for the line drawn in a) above can be determined by using the high-low method of cost 2. 3. The runit sold and fixed MOH per month. Show your caleulations and state your results as an pe Record your answer in the space provided in Packet 2 equation: 4. A regression trend line, prepared using the data presented above, produces the following cost -$ 0.57(x) +$ 10,870 the regression is.87. Compare this equation to the results of your high-low analysis. The r' for Which of the equations would be best provided in Packet 2. for Chris's analysis? Why? Record your answer in the space Part B: CVP analysis
Step by Step Solution
There are 3 Steps involved in it

Get step-by-step solutions from verified subject matter experts