

Question: Problem 3. The data are samples from three simulated diatributiona. Groupl 2. 97'36 0.9448 1.6394 0.0389 1.2958 Group2 0.?681 0.8627 0.2156 0.674 1.5676 Group3 4.8249
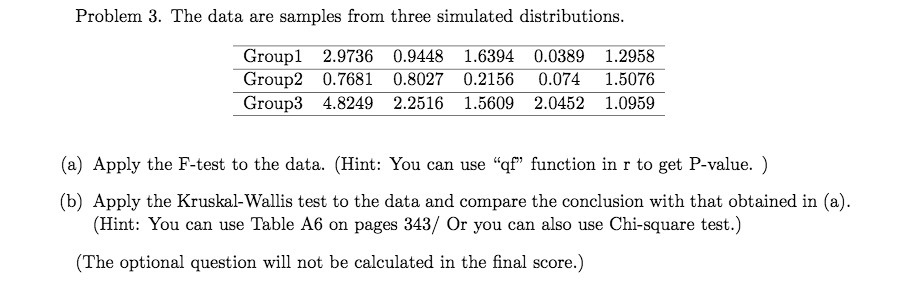
Problem 3. The data are samples from three simulated diatributiona. Groupl 2. 97'36 0.9448 1.6394 0.0389 1.2958 Group2 0.?681 0.8627 0.2156 0.674 1.5676 Group3 4.8249 2.2516 1.5609 2.6452 1.6959 (:1) Apply the Fteat to the data. (Hint: You can use \"qt\" function in r to get Pvalue. ) (h) Apply the Kmskal-Wallia test to the data and compare the conclusion with that obtained in (a). (Hint: You can use Table A6 on pages 343,; 01' you can also use Chi-square teat} [The optional question will not be calculated in the nal score.)
Step by Step Solution
There are 3 Steps involved in it
1 Expert Approved Answer
Step: 1 Unlock

Question Has Been Solved by an Expert!
Get step-by-step solutions from verified subject matter experts
Step: 2 Unlock
Step: 3 Unlock