

Question: Problem 3: The table below shows some data from the early days of the ABC clothing company. Each row in the table shows ABC sales
Problem 3: The table below shows some data from the early days of the ABC clothing company. Each row in the table shows ABC sales for a year and the amount spent on advertising that year.
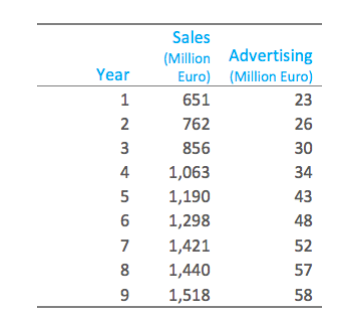
In this case, our outcome of interest is salesit is what we want to predict. If we use advertising as the predictor variable.
1- Draw a scatter plot to identify the type of relationship between the sales and amount spent on advertisement. (try to use coefficient of correlation to determine to what extant the relationship is linear or not).
2- Decide your mathematical model between the predicted variable (sales) to predicted by the regressor (amount spent on advertisement).
3- Use excel solver or any program to optimize the mathematical model parameters. Use the mean square error a.k.a second sum of error norm as objective function to be minimized.
4- Predict the amount of advisement needed to generate sales of 1,680 million Euro
solve using linear programming graphical solution
Sales (Million Euro 651 762 Advertising (Million Euro) 856 1,063 1,190 1,298 1,421 1,440 1,518 9Step by Step Solution
There are 3 Steps involved in it

Get step-by-step solutions from verified subject matter experts