

Question: Problem 3. Using simulink, run the accompanying simulation model. Export the data to matlab workspace using the technique shown in this link. Plot v_(L),i_(L),i_(C) ,
Problem 3. Using simulink, run the accompanying simulation model. Export the data to matlab workspace using the technique shown in this link. Plot
v_(L),i_(L),i_(C), and
v_(C)against time. Make your plot as legible, clear, and aesthetically pleasing as you can.\ Note: This is for your personal development and you will not loose marks if your graphs are not "pretty". But feel free to make yourself proud!\ Hint: Running the simulation will produce a variable called "out". You might run a code similar to the one shown below to extract the quantities in question.\
1t=out. ScopeData.time;
%reads the simulation time vector from the scope\ 2 vL = out. ScopeData.signals (1).values (?; % reads all values of the first (top) signal in the scope\ 3 iL = out. ScopeData.signals (2).values (?;\
_(4)iC=dots;%complete below
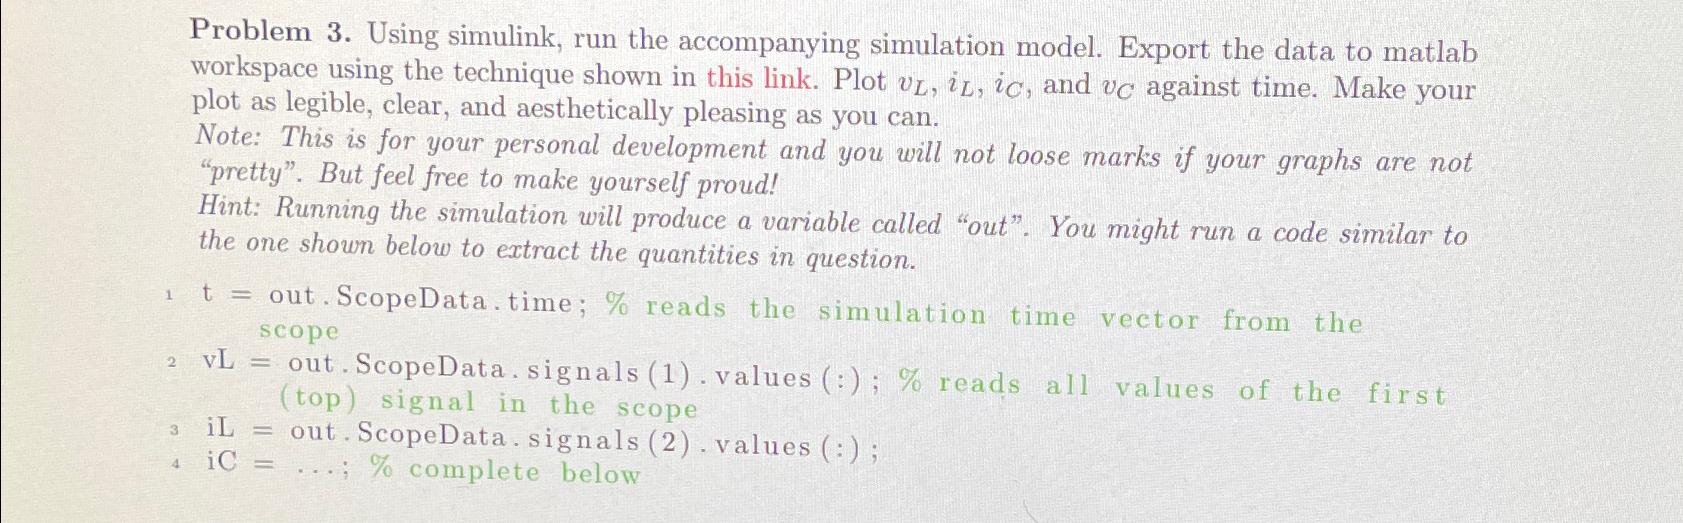
Problem 3. Using simulink, run the accompanying simulation model. Export the data to matlab workspace using the technique shown in this link. Plot vL,iL,iC, and vC against time. Make your plot as legible, clear, and aesthetically pleasing as you can. Note: This is for your personal development and you will not loose marks if your graphs are not "pretty". But feel free to make yourself proud! Hint: Running the simulation will produce a variable called "out". You might run a code similar to the one shown below to extract the quantities in question. t= out.ScopeData.time; \% reads the simulation time vector from the scope vL= out.ScopeData.signals (1).values (:); \% reads all values of the first (top) signal in the scope iL= out.ScopeData.signals (2). values (:); iC=;% complete below Problem 3. Using simulink, run the accompanying simulation model. Export the data to matlab workspace using the technique shown in this link. Plot vL,iL,iC, and vC against time. Make your plot as legible, clear, and aesthetically pleasing as you can. Note: This is for your personal development and you will not loose marks if your graphs are not "pretty". But feel free to make yourself proud! Hint: Running the simulation will produce a variable called "out". You might run a code similar to the one shown below to extract the quantities in question. t= out.ScopeData.time; \% reads the simulation time vector from the scope vL= out.ScopeData.signals (1).values (:); \% reads all values of the first (top) signal in the scope iL= out.ScopeData.signals (2). values (:); iC=;% complete below
Step by Step Solution
There are 3 Steps involved in it

Get step-by-step solutions from verified subject matter experts