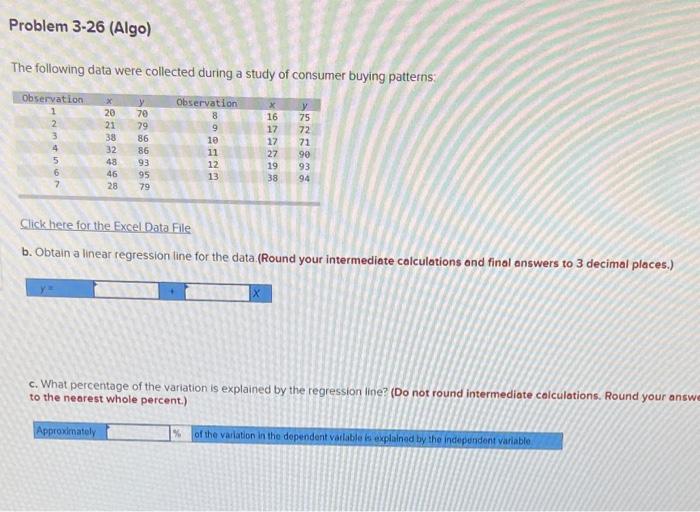
Question: Problem 3-26 (Algo) The following data were collected during a study of consumer buying patterns Observation y Observation 8 9 x 20 21 38 32

Problem 3-26 (Algo) The following data were
Problem 3-26 (Algo) The following data were collected during a study of consumer buying patterns Observation y Observation 8 9 x 20 21 38 32 48 46 28 y 70 29 86 86 93 95 79 X 16 17 17 27 19 38 4 5 6 7 11 12 13 90 93 94 Click here for the Excel Data File b. Obtain a linear regression line for the data (Round your intermediate calculations and final answers to 3 decimal places.) c. What percentage of the variation is explained by the regression line? (Do not round intermediate calculations. Round your answer to the nearest whole percent.) Approximately of the variation in the dependent valable is explained by the independent variable d. Use the equation determined in part b to predict the expected value of y for x-44 (Round your intermediate calculations and final answers to 3 decimal places.) y

Step by Step Solution

There are 3 Steps involved in it

1 Expert Approved Answer
Step: 1 Unlock blur-text-image
Question Has Been Solved by an Expert!

Get step-by-step solutions from verified subject matter experts

Step: 2 Unlock
Step: 3 Unlock

Students Have Also Explored These Related General Management Questions!