

Question: Problem 3-34 Earnings per Share (LO1) The table below contains data on Fincorp Inc. The balance sheet items correspond to values at year-end 2018 and
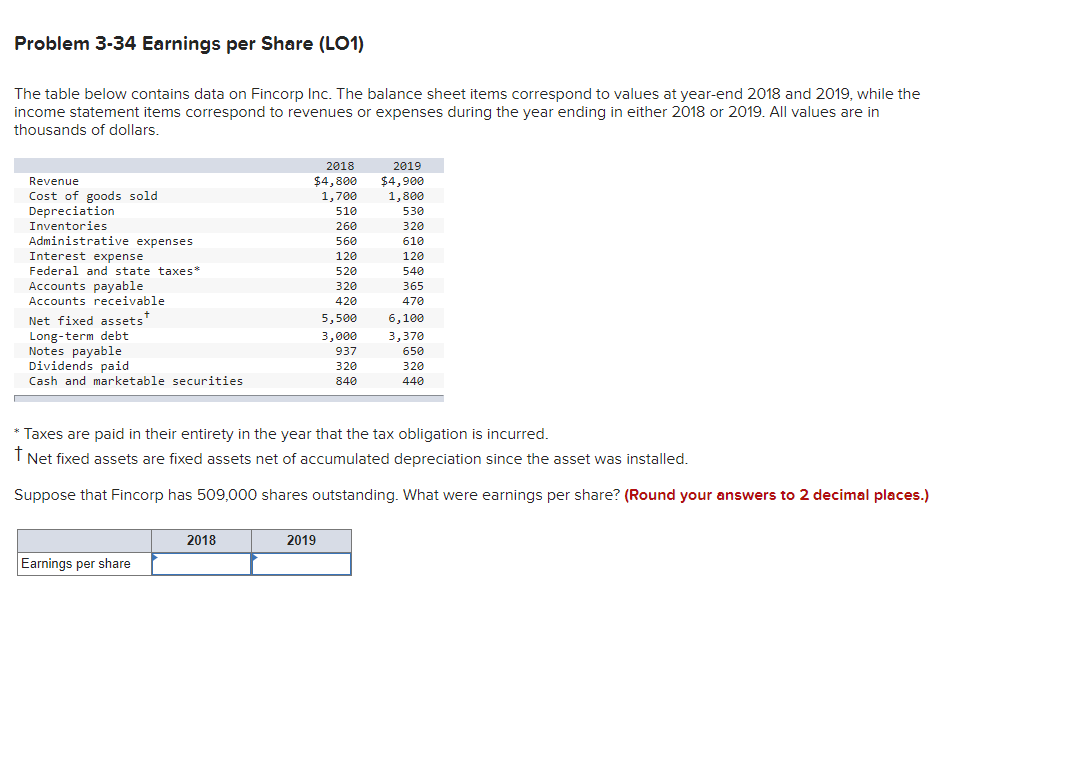
Problem 3-34 Earnings per Share (LO1) The table below contains data on Fincorp Inc. The balance sheet items correspond to values at year-end 2018 and 2019, while the income statement items correspond to revenues or expenses during the year ending in either 2018 or 2019. All values are in thousands of dollars. Revenue Cost of goods sold Depreciation Inventories Administrative expenses Interest expense Federal and state taxes* Accounts Accounts receivable Net fixed assets Long-term debt Notes payable Dividends paid Cash and marketable securities 2018 $4,800 1,700 510 260 560 120 520 320 420 5,500 100 3,000 937 320 840 2019 $4,900 1,800 530 320 610 120 540 365 470 6,100 3,370 650 320 440 payable * Taxes are paid in their entirety in the year that the tax obligation is incurred. t Net fixed assets are fixed assets net of accumulated depreciation since the asset was installed. Suppose that Fincorp has 509,000 shares outstanding. What were earnings per share? (Round your answers to 2 decimal places.) 2018 2019 Earnings per share
Step by Step Solution
There are 3 Steps involved in it

Get step-by-step solutions from verified subject matter experts