

Question: Problem 4 (10 points) For this question, please ensure that you plot graphs in excel. Points would be deducted for submitting hand-drawn plots. A. Use
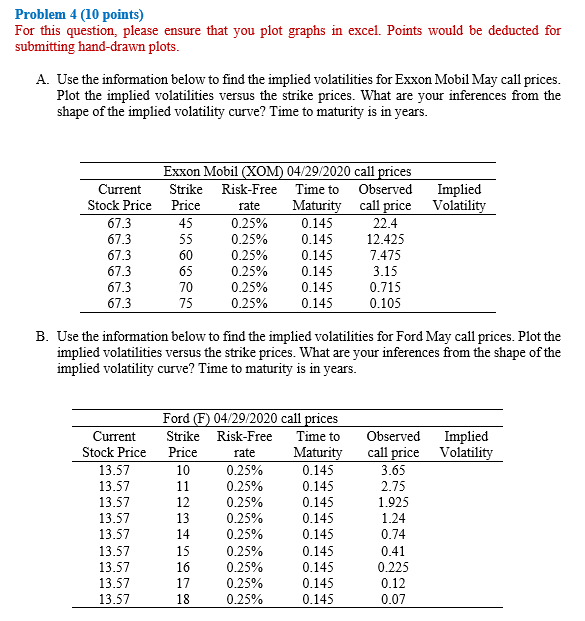
Problem 4 (10 points) For this question, please ensure that you plot graphs in excel. Points would be deducted for submitting hand-drawn plots. A. Use the information below to find the implied volatilities for Exxon Mobil May call prices. Plot the implied volatilities versus the strike prices. What are your inferences from the shape of the implied volatility curve? Time to maturity is in years. Current Stock Price 67.3 67.3 67.3 67.3 67.3 67.3 Exxon Mobil (XOM) 04/29/2020 call prices Strike Risk-Free Time to Observed Implied Price rate Maturity call price Volatility 45 0.25% 0.145 22.4 55 0.25% 0.145 12.425 60 0.25% 0.145 7.475 65 0.25% 0.145 3.15 70 0.25% 0.145 0.715 75 0.25% 0.145 0.105 B. Use the information below to find the implied volatilities for Ford May call prices. Plot the implied volatilities versus the strike prices. What are your inferences from the shape of the implied volatility curve? Time to maturity is in years. ied Volatility Current Stock Price 13.57 13.57 13.57 13.57 13.57 13.57 13.57 13.57 13.57 Ford (F) 04/29/2020 call prices Strike Risk-Free Time to Price rate Maturity 10 0.25% 0.145 11 0.25% 0.145 12 0.25% 0.145 13 0.25% 0.145 14 0.25% 0.145 15 0.25% 0.145 16 0.25% 0.145 17 0.25% 0.145 18 0.25% 0.145 Observed call price 3.65 2.75 1.925 1.24 0.74 0.41 0.225 0.12 0.07 Problem 4 (10 points) For this question, please ensure that you plot graphs in excel. Points would be deducted for submitting hand-drawn plots. A. Use the information below to find the implied volatilities for Exxon Mobil May call prices. Plot the implied volatilities versus the strike prices. What are your inferences from the shape of the implied volatility curve? Time to maturity is in years. Current Stock Price 67.3 67.3 67.3 67.3 67.3 67.3 Exxon Mobil (XOM) 04/29/2020 call prices Strike Risk-Free Time to Observed Implied Price rate Maturity call price Volatility 45 0.25% 0.145 22.4 55 0.25% 0.145 12.425 60 0.25% 0.145 7.475 65 0.25% 0.145 3.15 70 0.25% 0.145 0.715 75 0.25% 0.145 0.105 B. Use the information below to find the implied volatilities for Ford May call prices. Plot the implied volatilities versus the strike prices. What are your inferences from the shape of the implied volatility curve? Time to maturity is in years. ied Volatility Current Stock Price 13.57 13.57 13.57 13.57 13.57 13.57 13.57 13.57 13.57 Ford (F) 04/29/2020 call prices Strike Risk-Free Time to Price rate Maturity 10 0.25% 0.145 11 0.25% 0.145 12 0.25% 0.145 13 0.25% 0.145 14 0.25% 0.145 15 0.25% 0.145 16 0.25% 0.145 17 0.25% 0.145 18 0.25% 0.145 Observed call price 3.65 2.75 1.925 1.24 0.74 0.41 0.225 0.12 0.07
Step by Step Solution
There are 3 Steps involved in it

Get step-by-step solutions from verified subject matter experts