

Question: Problem 4 ( 2 5 points ) ( Corc Coursc Outcome 2 , 4 & 1 1 ) Write a script to plot the data
Problem pointsCorc Coursc Outcome &
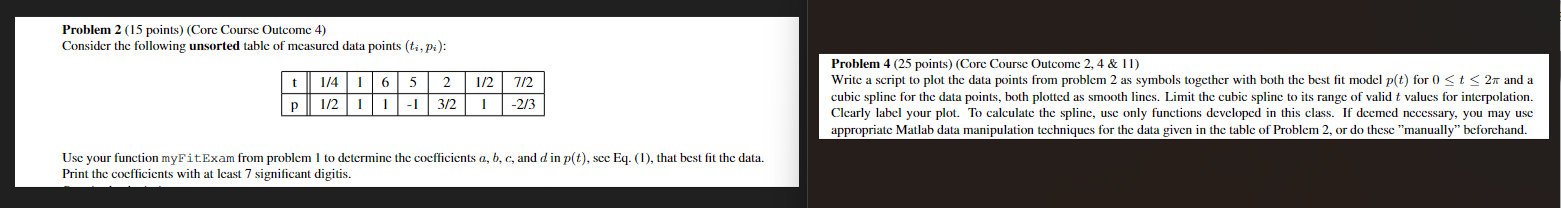
Write a script to plot the data points from problem as symbols together with both the best fit model for and a
cubic spline for the data points, both plotted as smooth lines. Limit the cubic spline to its range of valid values for interpolation.
Clearly label your plot. To calculate the spline, use only functions developed in this class. If deemed necessary, you may use
appropriate Matlab data manipulation techniques for the data given in the table of Problem or do these "manually" beforehand.
HOW WOULD I SOLVE FOR PROBLEM IN MATLAB USING DATA FROM PROBLEM
Step by Step Solution
There are 3 Steps involved in it
1 Expert Approved Answer
Step: 1 Unlock

Question Has Been Solved by an Expert!
Get step-by-step solutions from verified subject matter experts
Step: 2 Unlock
Step: 3 Unlock