

Question: Problem 4 (20 points). The below table show the historical production in units for a given company of X product. The data appears to exhibit
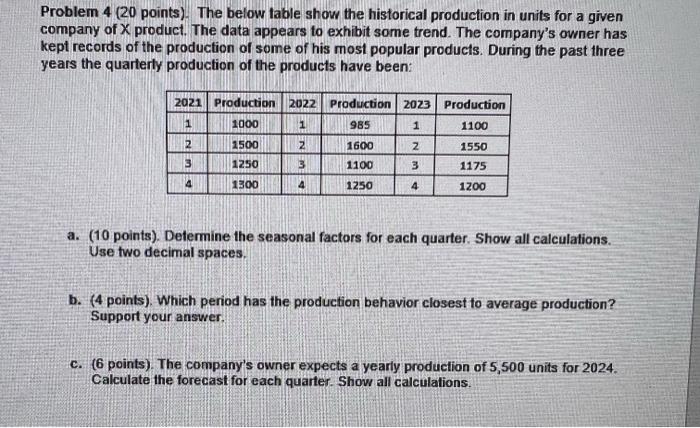
Problem 4 (20 points). The below table show the historical production in units for a given company of X product. The data appears to exhibit some trend. The company's owner has kept records of the production of some of his most popular products. During the past three years the quarterly production of the products have been: a. (10 points). Determine the seasonal factors for each quarter. Show all calculations. Use two decimal spaces. b. (4 points). Which period has the production behavior closest to average production? Support your answer. c. (6 points). The company's owner expects a yearly production of 5,500 units for 2024. Calculate the forecast for each quarter. Show all calculations
Step by Step Solution
There are 3 Steps involved in it

Get step-by-step solutions from verified subject matter experts