

Question: Problem # 4 ( 20 pts). Make sure you show your work, or you lose 20 pts). The following frequency distribution table represents the daily

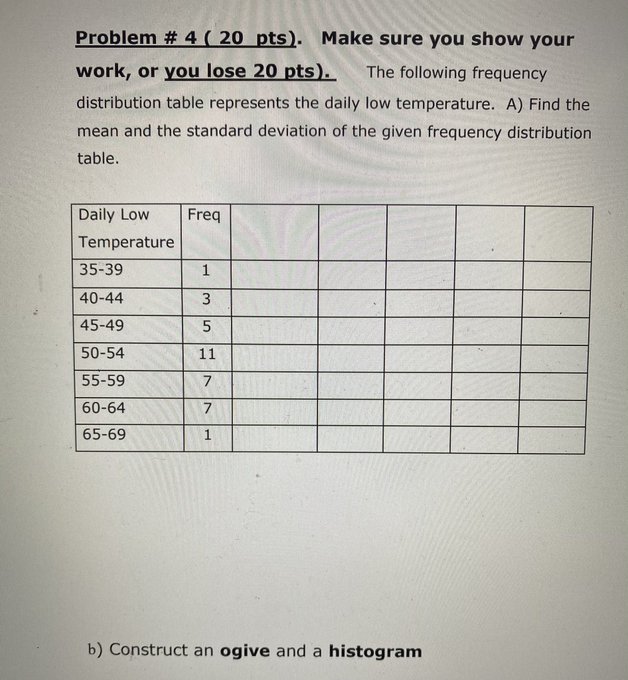
Problem # 4 ( 20 pts). Make sure you show your work, or you lose 20 pts). The following frequency distribution table represents the daily low temperature. A) Find the mean and the standard deviation of the given frequency distribution table. Daily Low Freq Temperature 35-39 1 40-44 3 45-49 5 50-54 11 55-59 7 60-64 7 65-69 1 b) Construct an ogive and a histogram
Step by Step Solution
There are 3 Steps involved in it
1 Expert Approved Answer
Step: 1 Unlock

Question Has Been Solved by an Expert!
Get step-by-step solutions from verified subject matter experts
Step: 2 Unlock
Step: 3 Unlock