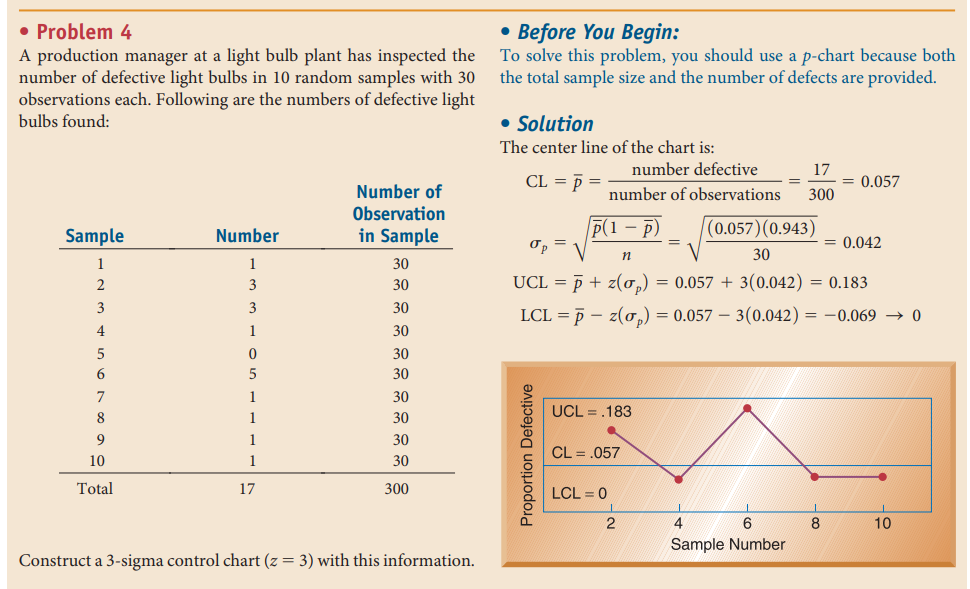
Question: . Problem 4 A production manager at a light bulb plant has inspected the number of defective light bulbs in 10 random samples with 30

. Problem 4 A production manager at a light bulb

. Problem 4 A production manager at a light bulb plant has inspected the number of defective light bulbs in 10 random samples with 30 observations each. Following are the numbers of defective light bulbs found: Before You Begin: To solve this problem, you should use a p-chart because both the total sample size and the number of defects are provided. Solution The center line of the chart is: number defective CL = = = number of observations 17 = 0.057 300 Sample Number (1-7) (0.057) (0.943) Op = = 0.042 n Number of Observation in Sample 30 30 30 30 30 1 2 1 3 UCL = + + z(0) = 0.057 + 3(0.042) = 0.183 LCL = 7 z(0) = 0.057 3(0.042) = -0.069 0 3 4 5 6 3 1 0 5 7 30 30 30 30 30 30 1 1 1 8 UCL = .183 9 10 Proportion Defective CL = .057 1 Total 17 300 LCL = 0 2 1 8 10 4 6 Sample Number Construct a 3-sigma control chart (z = 3) with this information

Step by Step Solution

There are 3 Steps involved in it

1 Expert Approved Answer
Step: 1 Unlock blur-text-image
Question Has Been Solved by an Expert!

Get step-by-step solutions from verified subject matter experts

Step: 2 Unlock
Step: 3 Unlock

Students Have Also Explored These Related General Management Questions!