

Question: Problem 4 . Consolidation and Time - settlement curve ( 4 0 pts ) a . A laboratory consolidation test was performed and yielded the
Problem Consolidation and Timesettlement curve pts
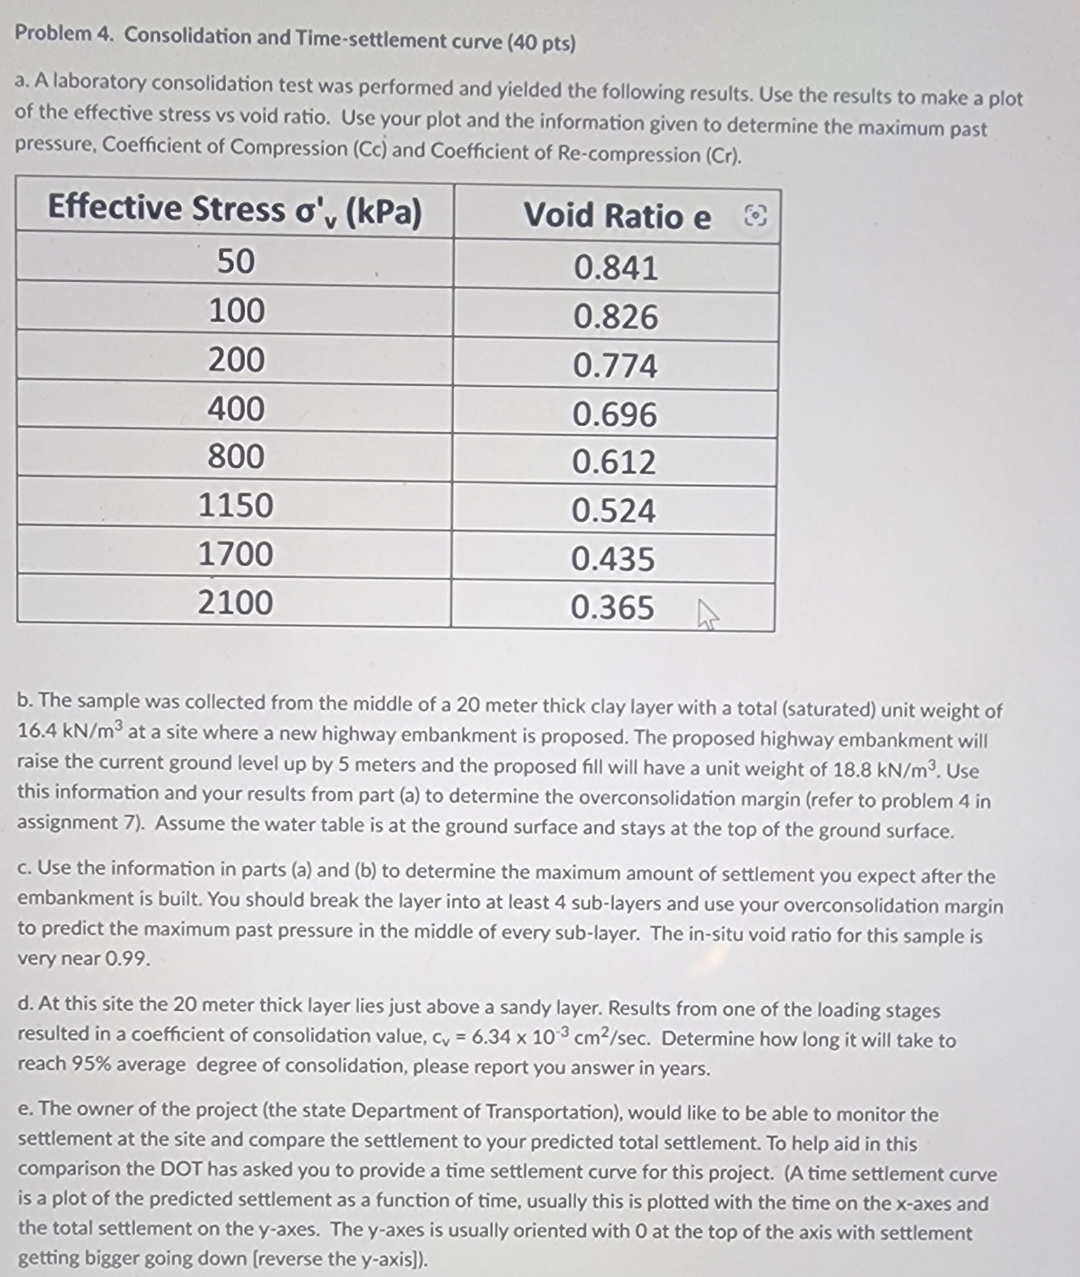
a A laboratory consolidation test was performed and yielded the following results. Use the results to make a plot of the effective stress vs void ratio. Use your plot and the information given to determine the maximum past pressure, Coefficient of Compression Cc and Coefficient of Recompression Cr
tableEffective Stress Void Ratio e
b The sample was collected from the middle of a meter thick clay layer with a total saturated unit weight of at a site where a new highway embankment is proposed. The proposed highway embankment will raise the current ground level up by meters and the proposed fill will have a unit weight of Use this information and your results from part a to determine the overconsolidation margin refer to problem in assignment Assume the water table is at the ground surface and stays at the top of the ground surface.
c Use the information in parts a and b to determine the maximum amount of settlement you expect after the embankment is built. You should break the layer into at least sublayers and use your overconsolidation margin to predict the maximum past pressure in the middle of every sublayer. The insitu void ratio for this sample is very near
d At this site the meter thick layer lies just above a sandy layer. Results from one of the loading stages resulted in a coefficient of consolidation value, Determine how long it will take to reach average degree of consolidation, please report you answer in years.
e The owner of the project would like to be able to monitor the settlement at the site and compare the settlement to your predicted total settlement. A time settlement curve is a plot of the predicted settlement as a function of time, usually this is plotted with the time on the axes and the total settlement on the axes. The axes is usually oriented with at the top of the axis with settlement getting bigger going down reverse the axis
Step by Step Solution
There are 3 Steps involved in it
1 Expert Approved Answer
Step: 1 Unlock

Question Has Been Solved by an Expert!
Get step-by-step solutions from verified subject matter experts
Step: 2 Unlock
Step: 3 Unlock