

Question: Problem 4- Expected times in weeks, as well as variances, for the major activities of an project are depicted in the following table. Determine the
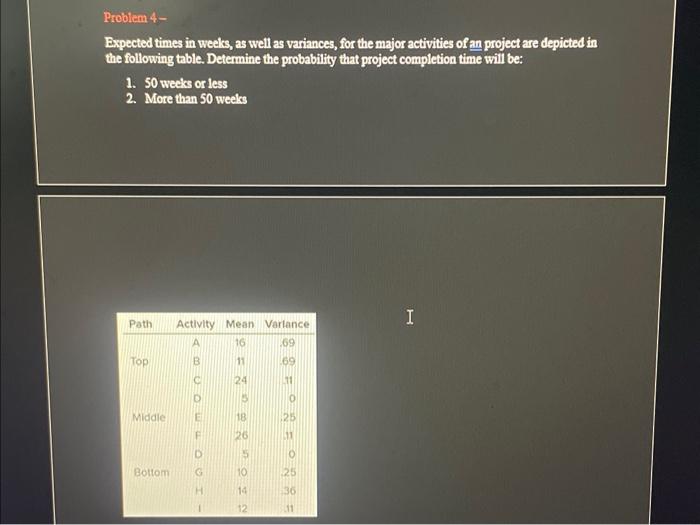
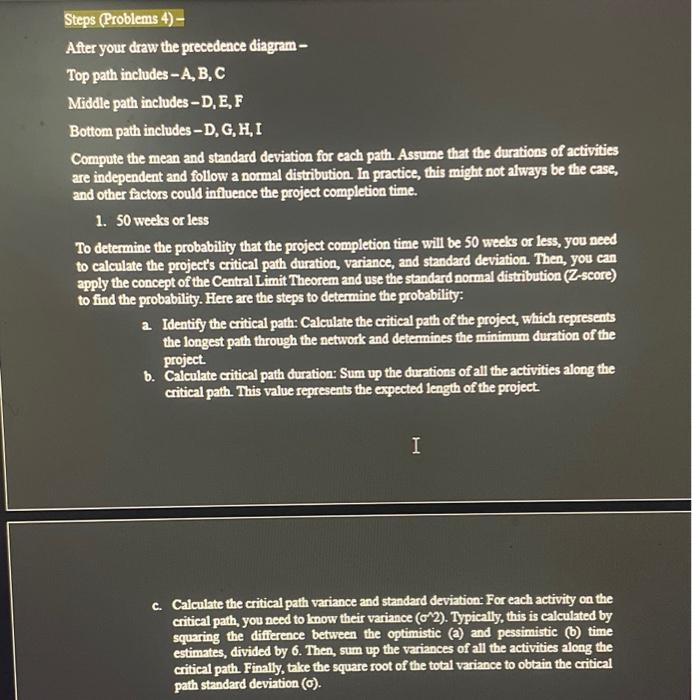

Problem 4- Expected times in weeks, as well as variances, for the major activities of an project are depicted in the following table. Determine the probability that project completion time will be: 1. 50 weeks or less 2. More than 50 weeks Steps (Problems 4) - After your draw the precedence diagram- Top path includes - A, B, C Middle path includes -D, E, F Bottom path includes -D, G, H, I Compute the mean and standard deviation for each path. Assume that the durations of activities are independent and follow a normal distribution. In practice, this might not always be the case, and other factors could influence the project completion time. 1. 50 weeks or less To determine the probability that the project completion time will be 50 weeks or less, you need to calculate the project's critical path duration, variance, and standard deviation. Then, you can apply the concept of the Central Limit Theorem and use the standard normal distribution (Z-score) to find the probability. Here are the steps to determine the probability: a. Identify the critical path: Calculate the critical path of the project, which represents the longest path through the network and determines the minimum duration of the project. b. Calculate critical path duration: Sum up the durations of all the activities along the critical path. This value represents the expected length of the project. c. Calculate the critical path variance and standard deviation: For each activity on the critical path, you need to know their variance (2). Typically, this is calculated by squaring the difference between the optimistic (a) and pessimistic (b) time estimates, divided by 6 . Then, sum up the variances of all the activities along the critical path Finally, take the square root of the total variance to obtrin the critical path standard deviation (o). c. Calculate the critical path variance and standard deviation: For each activity on the critical path, you need to know their variance (2). Typically, this is calculated by squaring the difference between the optimistic (a) and pessimistic (b) time estimates, divided by 6 . Then, sum up the variances of all the activities along the critical path. Finaliy, take the square root of the total variance to obtain the critical path standard deviation (). d. Calculate the Z-score: The Z-score is a measure that helps you determine how far a particular data point is from the mean, in terms of standard deviations. Calculate the Z-score using the following formula: Z= (Target completion time - Expected completion time) / Standard deviation Z=(50weeks-Criticalpathduration)/ e. Determine the probability: Use a standard normal distribution table (Z-table) or an online Z-score calculator to find the probability corresponding to the calculated Zscore. This value represents the probability that the project completion time will be 50 weeks or less. 2. Determine the probability for more than 50 weeks: a. Since probabilities add up to 1 , subtract the probability (P (duration 50 weeks) from 1 to find the probability that the project completion time will be more than 50 weeks. Probability (more than 50 weeks) = 1 - Probability ( 50 weeks or less)
Step by Step Solution
There are 3 Steps involved in it

Get step-by-step solutions from verified subject matter experts