

Question: problem 4 Figure 2.3. Suppose Supplier B improves its 4. () (Microsoft Excel problem) The following figure shows an ce quality so that the chemicals
problem 4 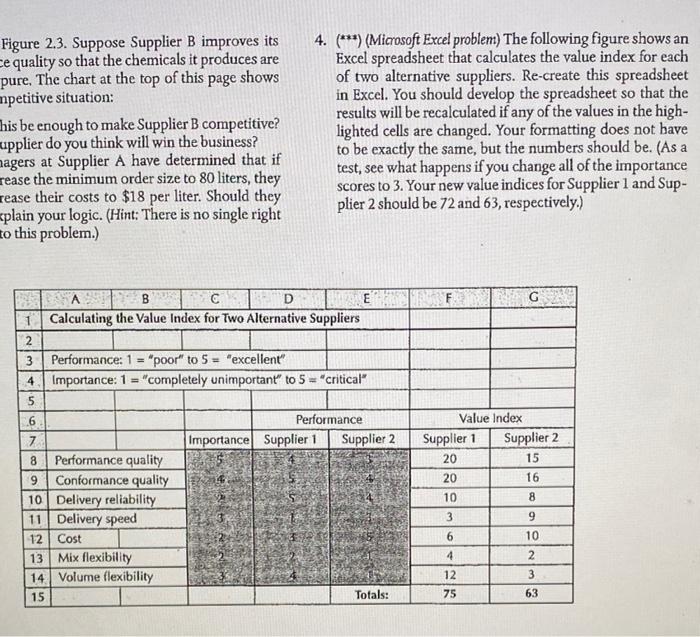
Figure 2.3. Suppose Supplier B improves its 4. () (Microsoft Excel problem) The following figure shows an ce quality so that the chemicals it produces are Excel spreadsheet that calculates the value index for each pure. The chart at the top of this page shows of two alternative suppliers. Re-create this spreadsheet npetitive situation: in Excel. You should develop the spreadsheet so that the \begin{tabular}{ll} his be enough to make Supplier B competitive? & results will be recalculated if any of the values in the high- \\ upplier do you think will win the business? & lighted cells are changed. Your formatting does not bave \\ to be exactly the same, but the numbers should be. (As a \\ reagers at Supplier A have determined that if & test, see what happens if you change all of the importance \\ rease the minimum order size to 80 liters, they & scores to 3. Your new value indices for Supplier 1 and Sup- \\ rease their costs to $18 per liter. Should they & plier 2 should be 72 and 63 , respectively.) \\ \hline thin pour logic. (Hint: There is no single right \end{tabular}
Step by Step Solution
There are 3 Steps involved in it
1 Expert Approved Answer
Step: 1 Unlock

Question Has Been Solved by an Expert!
Get step-by-step solutions from verified subject matter experts
Step: 2 Unlock
Step: 3 Unlock