

Question: Problem 4 Forecasting ( 2 5 % ) : PART 1 : Following table shows the actuals and forecasts from a beer manufacturer in six
Problem Forecasting :
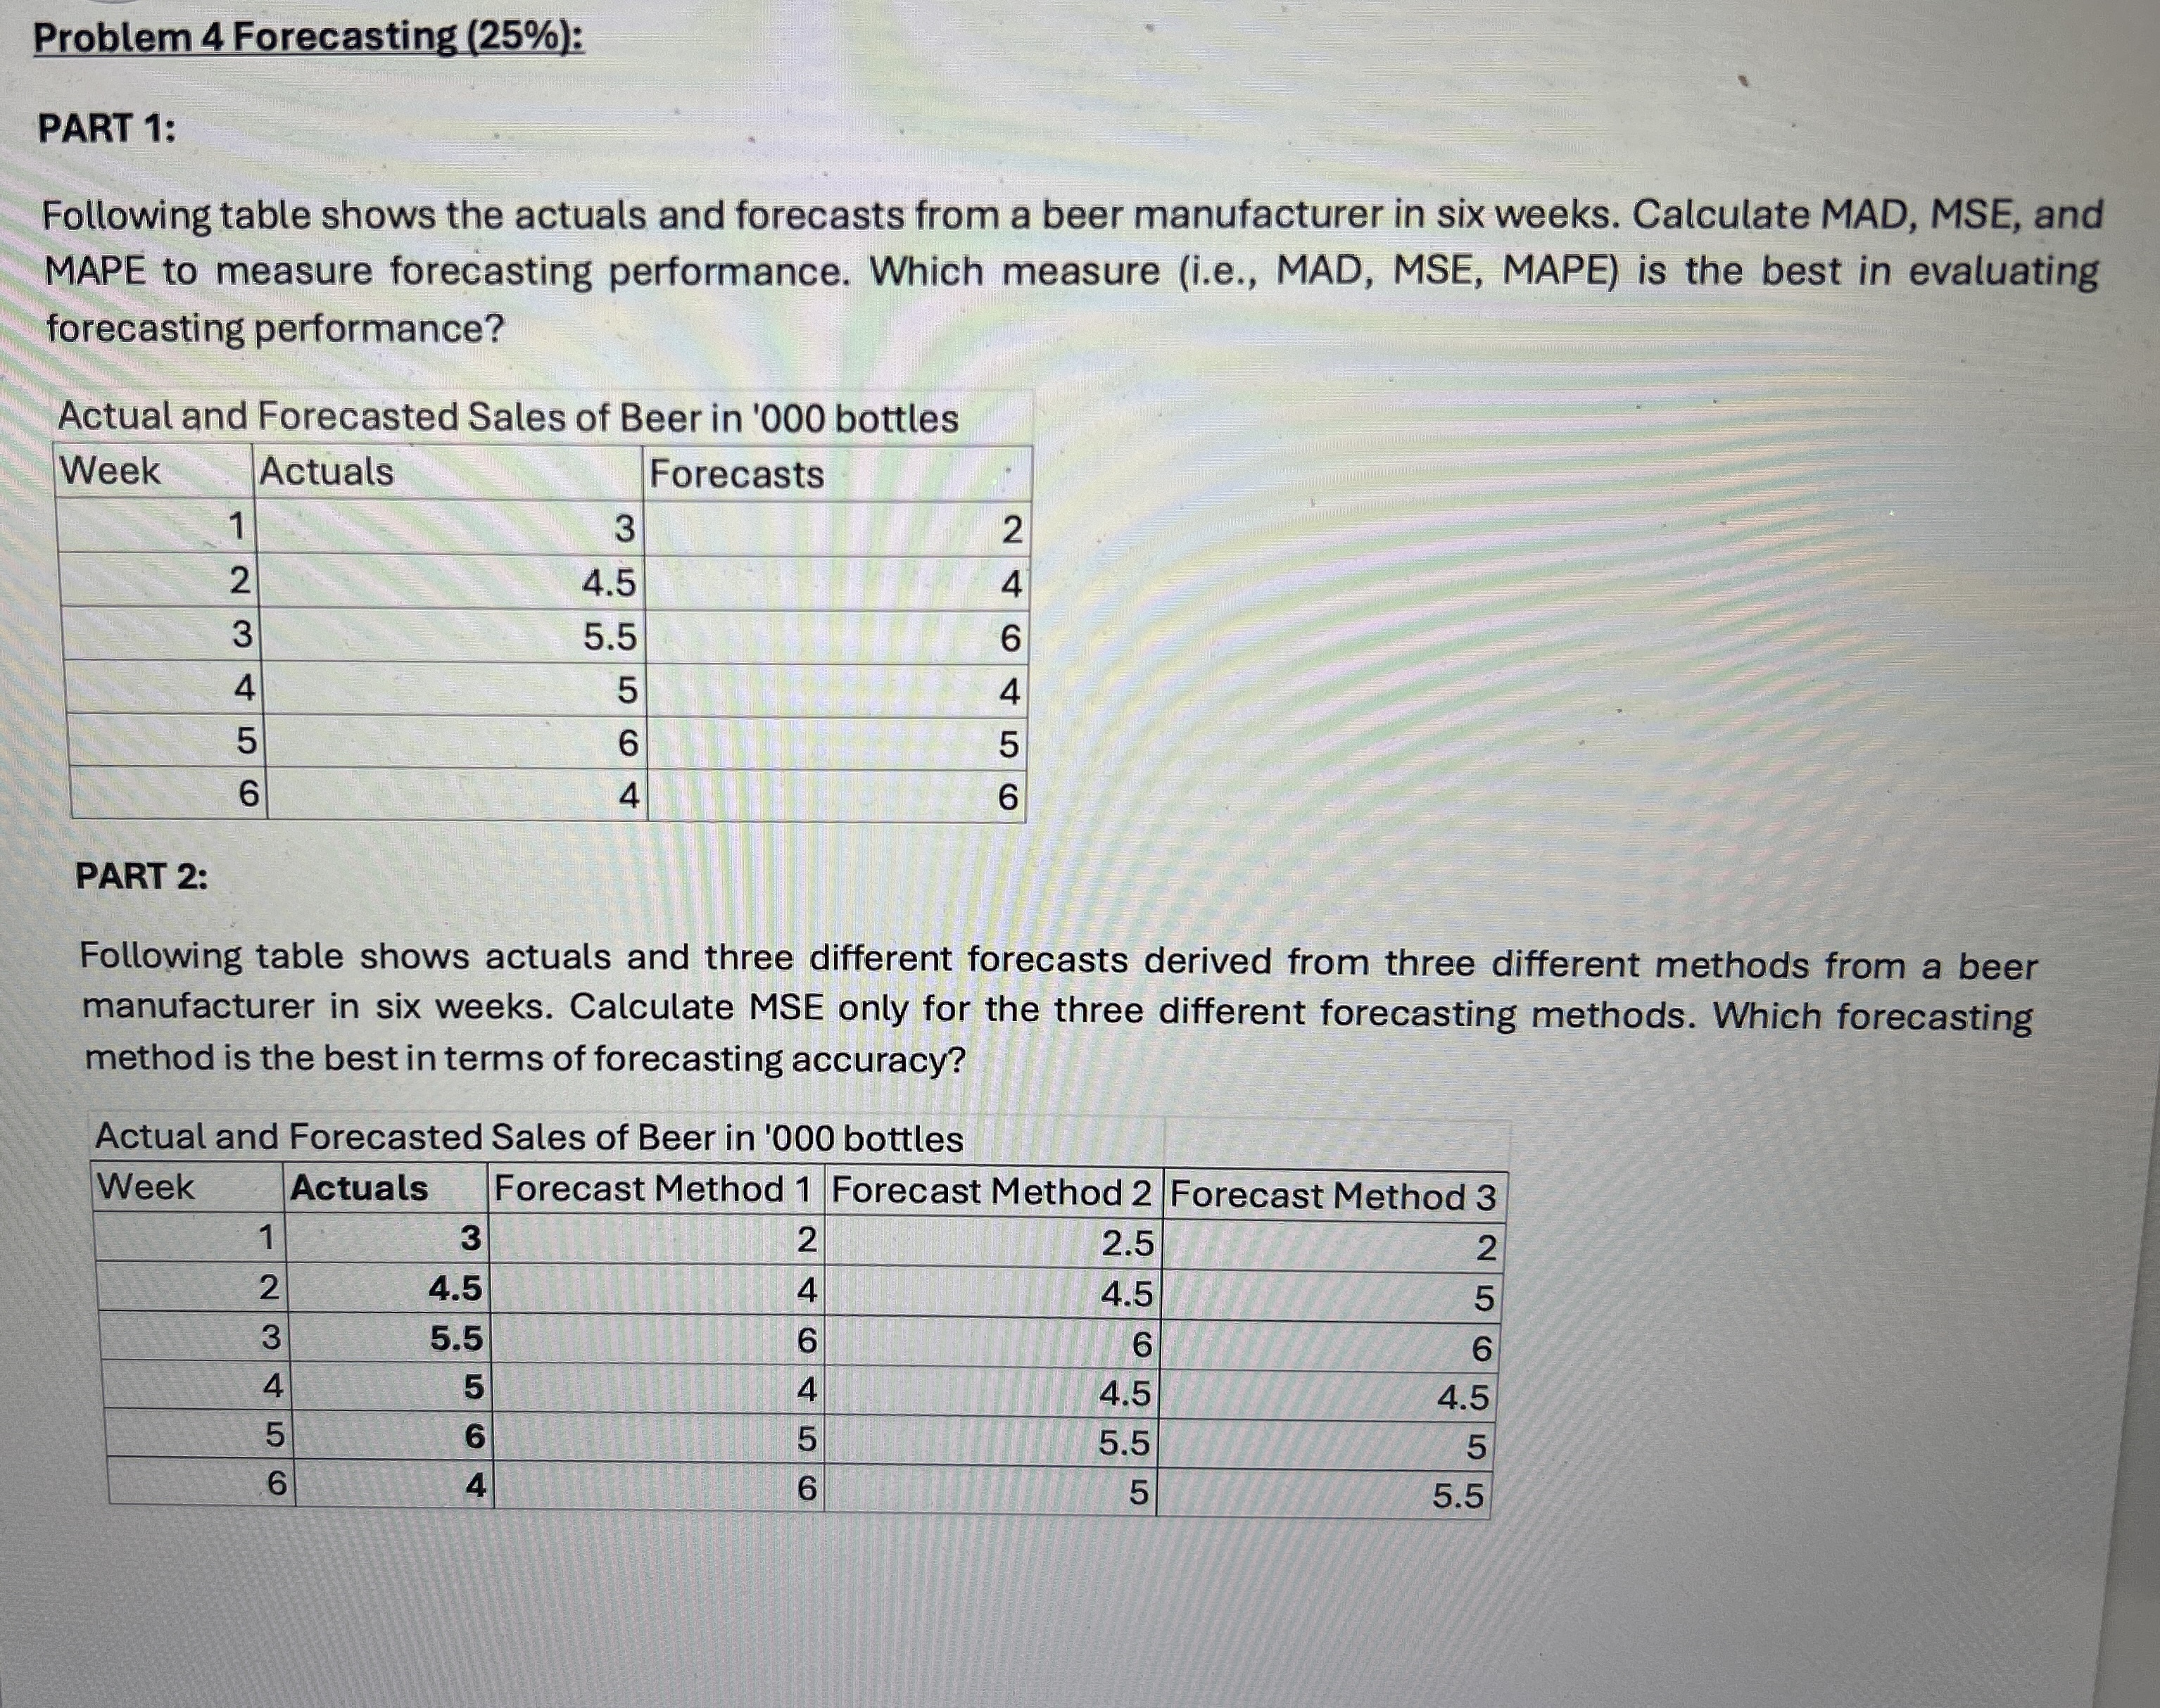
PART :
Following table shows the actuals and forecasts from a beer manufacturer in six weeks. Calculate MAD, MSE, and
MAPE to measure forecasting performance. Which measure ie MAD, MSE, MAPE is the best in evaluating
forecasting performance?
Actual and Forecasted Sales of Beer in bottles
PART :
Following table shows actuals and three different forecasts derived from three different methods from a beer
manufacturer in six weeks. Calculate MSE only for the three different forecasting methods. Which forecasting
method is the best in terms of forecasting accuracy?
Actual and Forecasted Sales of Beer in bottles
Step by Step Solution
There are 3 Steps involved in it
1 Expert Approved Answer
Step: 1 Unlock

Question Has Been Solved by an Expert!
Get step-by-step solutions from verified subject matter experts
Step: 2 Unlock
Step: 3 Unlock