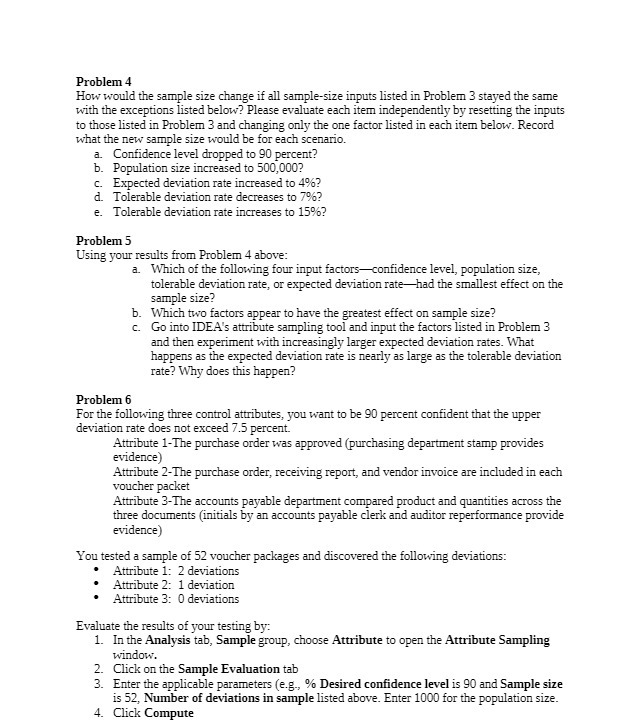
Question: Problem 4 How would the sample size change if all sample-size inputs listed in Problem 3 stayed the same with the exceptions listed below? Please

Problem 4 How would the sample size change if all
Problem 4 How would the sample size change if all sample-size inputs listed in Problem 3 stayed the same with the exceptions listed below? Please evaluate each item independently by resetting the inputs to those listed in Problem 3 and changing only the one factor listed in each item below. Record what the new sample size would be for each scenario. a. Confidence level dropped to 90 percent? b. Population size increased to 500,000? C- Expected deviation rate increased to 46? 1. Tolerable deviation rate decreases to 79%? e. Tolerable deviation rate increases to 159%? Problem 5 Using your results from Problem 4 above: a. Which of the following four input factors-confidence level, population size, tolerable deviation rate, or expected deviation rate-had the smallest effect on the sample size? b. Which two factors appear to have the greatest effect on sample size? c. Go into IDEA's attribute sampling tool and input the factors listed in Problem 3 and then experiment with increasingly larger expected deviation rates. What happens as the expected deviation rate is nearly as large as the tolerable deviation rate? Why does this happen? Problem 6 For the following three control attributes, you want to be 90 percent confident that the upper deviation rate does not exceed 7.5 percent. Attribute 1-The purchase order was approved (purchasing department stamp provides evidence) Attribute 2-The purchase order, receiving report, and vendor invoice are included in each voucher packet Attribute 3-The accounts payable department compared product and quantities across the three documents (initials by an accounts payable clerk and auditor reperformance provide evidence You tested a sample of 52 voucher packages and discovered the following deviations: Attribute 1: 2 deviations Attribute 2: 1 deviation Attribute 3: 0 deviations Evaluate the results of your testing by: 1. In the Analysis tab, Sample group, choose Attribute to open the Attribute Sampling window. 2. Click on the Sample Evaluation tab 3. Enter the applicable parameters (e.g., % Desired confidence level is 90 and Sample size is 52, Number of deviations in sample listed above. Enter 1000 for the population size. 4. Click Compute

Step by Step Solution

There are 3 Steps involved in it

1 Expert Approved Answer
Step: 1 Unlock blur-text-image
Question Has Been Solved by an Expert!

Get step-by-step solutions from verified subject matter experts

Step: 2 Unlock
Step: 3 Unlock

Students Have Also Explored These Related Accounting Questions!