Question: Problem 4 In the manual simulation of Section 3.3.1 and the Excel file Model 03 04.xls, speed up the service times by decreasing them all
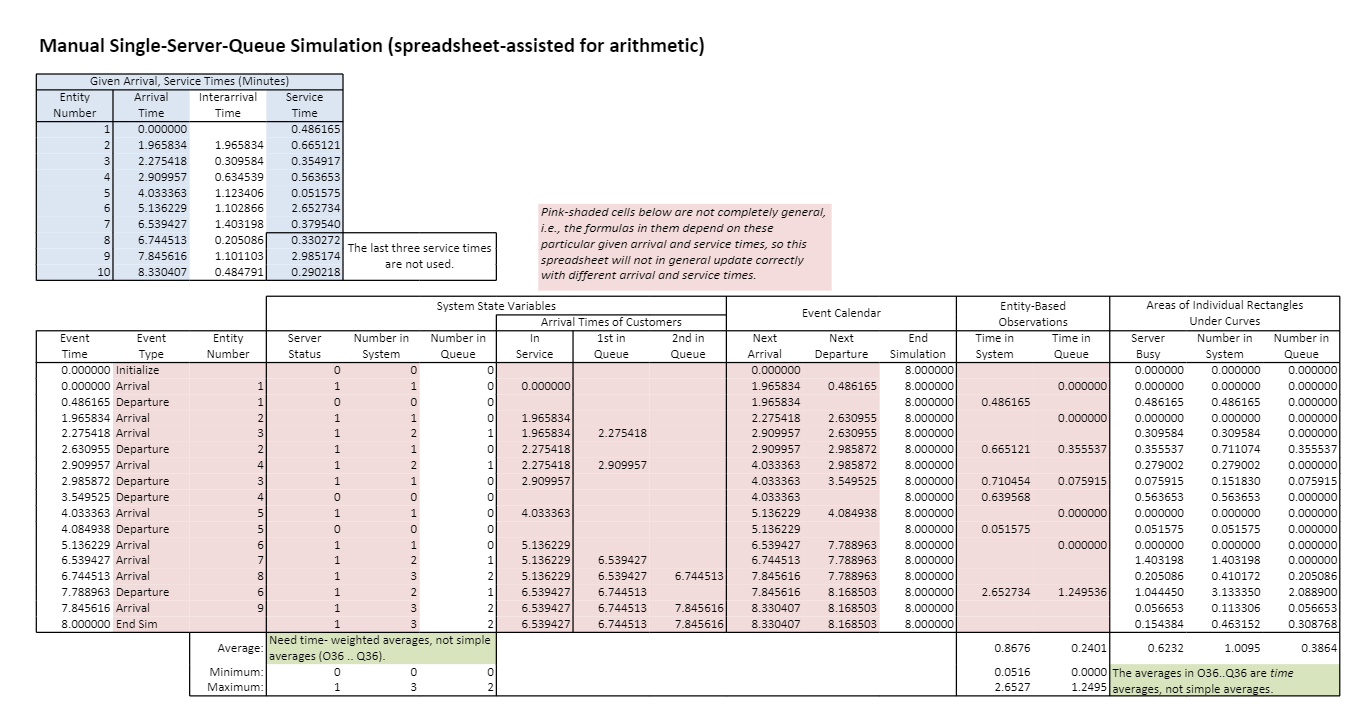
Problem 4 In the manual simulation of Section 3.3.1 and the Excel file Model 03 04.xls, speed up the service times by decreasing them all by 20%. What's the effect on the same set of output performance measures? Discuss (in particular) utilization, average time in the system, average time in the queue, L, and Lq? Manual Single-Server-Queue Simulation (spreadsheet-assisted for arithmetic) 0.5636531 4 Given Arrival, Service Times (Minutes) Entity Arrival Interarrival Service Number Time Time Time 1 0.000000 0.486165 2 1.965834 1.965834 0.665121 3 2.275418 0.309584 0.354917 4 2.909957 0.634539 5 5 1.123406 0.051575 6 6 5.136229 1.102866 2.652734 ..652734 7 6.539427 1.403198 0.379540 8 6.744513 0.205086 9 9 7.845616 1.101103 2.9851741 10 8.330407 0.484791 0.290218 0.330272 The last three service times Pink-shaded cells below are not completely general, i.e., the formulas in them depend on these particular given arrival and service times, so this spreadsheet will not in general update correctly with different arrival and service times. are not used. Event Calendar Entity-Based Observations Time in Time in System Queue Next Departure 0.486165 0.000000 0.486165 0.000000 0.665121 Event Event Time Type 0.000000 Initialize 0.000000 Arrival 0.486165 Departure 1.965834 Arrival 2.275418 Arrival 2.630955 Departure 2.909957 Arrival 2.985872 Departure 3.549525 Departure 4.033363 Arrival * 4.084938 Departure pa 5.136229 Arrival 6.539427 Arrival 6.744513 Arrival 7.788963 Departure 7.845616 Arrival 8.000000 End Sim 2.630955 2.630955 2.985872 2.985872 3.549525 0.355537 Next Arrival 0.000000 1.965834 OCTO 1.965834 2.275418 2.909957 2.909957 4.033363 4.033363 4.033363 5.136229 120429 5.136229 --- 6.539427 2012 6.744513 re 7.845616 7.845616 8.330407 8.330407 System State Variables Arrival Times of Customers Entity Server Number in Number in In 1st in 2nd in Number Status System Queue Service Queue Queue 0 0 1 1 0 0.000000 1 0 0 0 1 1 0 1.965834 3 1 2 1 1.965834 2.275418 2 1 1 0 2.275418 4 1 2 1 2.275418 2.909957 1 1 0 2.909957 0 0 0 1 1 0 4.033363 0 0 0 1 1 0 5.136229 1 2 1 5.136229 6.539427 8 1 3 2 5.1362291 6.539427 6.744513 6 1 2 1 6.539427 6.744513 9 1 3 2 6.539427 6.744513 7.845616 1 3 2 6.539427 6.744513 7.845616 Average Need time- weighted averages, not simple averages (036 .. 036) Minimum: 0 0 0 Maximum: 1 3 2 End Simulation 8.000000 8.000000 8.000000 &000000 8.000000 8.000000 8.000000 8.000000 8.000000 8.000000 . 8.000000 . 8.000000 8.000000 8.000000 8.000000 8.000000 8.000000 8.000000 Areas of Individual Rectangles Under Curves Server Number in Number in Busy System Queue 0.000000 0.000000 0.000000 0.000000 0.000000 0.000000 000000 0.486165 0.486165 0.000000 000000 0.000000 0.000000 0.000000 0.309584 0.309584 0.000000 0.355537 0.711074 0.355537 0.279002 0.279002 0.000000 Doser 0.075915 0.151830 0.075915 0.563653 0.563653 0.000000 0.000000 0.000000 0.000000 wed 0.051575 0.051575 0.000000 S. . 0.000000 0.000000 0.000000 1.403198 1.403198 0.000000 0.205086 0.410172 110175 0.205086 1.044450 3.133350 2.088900 0.056653 0.113306 0.056653 0.154384 0.463152 0.308768 0.075915 0.710454 0.639568 4.084938 0.000000 0.051575 0.000000 7.788963 7.788963 7.788963 8.168503 8.168503 8.168503 2.652734 1.249536 0.8676 0.2401 0.6232 1.0095 0.3864 0.0516 2.6527 0.0000 The averages in 036.036 are time 1.2495 averages, not simple averages. Problem 4 In the manual simulation of Section 3.3.1 and the Excel file Model 03 04.xls, speed up the service times by decreasing them all by 20%. What's the effect on the same set of output performance measures? Discuss (in particular) utilization, average time in the system, average time in the queue, L, and Lq? Manual Single-Server-Queue Simulation (spreadsheet-assisted for arithmetic) 0.5636531 4 Given Arrival, Service Times (Minutes) Entity Arrival Interarrival Service Number Time Time Time 1 0.000000 0.486165 2 1.965834 1.965834 0.665121 3 2.275418 0.309584 0.354917 4 2.909957 0.634539 5 5 1.123406 0.051575 6 6 5.136229 1.102866 2.652734 ..652734 7 6.539427 1.403198 0.379540 8 6.744513 0.205086 9 9 7.845616 1.101103 2.9851741 10 8.330407 0.484791 0.290218 0.330272 The last three service times Pink-shaded cells below are not completely general, i.e., the formulas in them depend on these particular given arrival and service times, so this spreadsheet will not in general update correctly with different arrival and service times. are not used. Event Calendar Entity-Based Observations Time in Time in System Queue Next Departure 0.486165 0.000000 0.486165 0.000000 0.665121 Event Event Time Type 0.000000 Initialize 0.000000 Arrival 0.486165 Departure 1.965834 Arrival 2.275418 Arrival 2.630955 Departure 2.909957 Arrival 2.985872 Departure 3.549525 Departure 4.033363 Arrival * 4.084938 Departure pa 5.136229 Arrival 6.539427 Arrival 6.744513 Arrival 7.788963 Departure 7.845616 Arrival 8.000000 End Sim 2.630955 2.630955 2.985872 2.985872 3.549525 0.355537 Next Arrival 0.000000 1.965834 OCTO 1.965834 2.275418 2.909957 2.909957 4.033363 4.033363 4.033363 5.136229 120429 5.136229 --- 6.539427 2012 6.744513 re 7.845616 7.845616 8.330407 8.330407 System State Variables Arrival Times of Customers Entity Server Number in Number in In 1st in 2nd in Number Status System Queue Service Queue Queue 0 0 1 1 0 0.000000 1 0 0 0 1 1 0 1.965834 3 1 2 1 1.965834 2.275418 2 1 1 0 2.275418 4 1 2 1 2.275418 2.909957 1 1 0 2.909957 0 0 0 1 1 0 4.033363 0 0 0 1 1 0 5.136229 1 2 1 5.136229 6.539427 8 1 3 2 5.1362291 6.539427 6.744513 6 1 2 1 6.539427 6.744513 9 1 3 2 6.539427 6.744513 7.845616 1 3 2 6.539427 6.744513 7.845616 Average Need time- weighted averages, not simple averages (036 .. 036) Minimum: 0 0 0 Maximum: 1 3 2 End Simulation 8.000000 8.000000 8.000000 &000000 8.000000 8.000000 8.000000 8.000000 8.000000 8.000000 . 8.000000 . 8.000000 8.000000 8.000000 8.000000 8.000000 8.000000 8.000000 Areas of Individual Rectangles Under Curves Server Number in Number in Busy System Queue 0.000000 0.000000 0.000000 0.000000 0.000000 0.000000 000000 0.486165 0.486165 0.000000 000000 0.000000 0.000000 0.000000 0.309584 0.309584 0.000000 0.355537 0.711074 0.355537 0.279002 0.279002 0.000000 Doser 0.075915 0.151830 0.075915 0.563653 0.563653 0.000000 0.000000 0.000000 0.000000 wed 0.051575 0.051575 0.000000 S. . 0.000000 0.000000 0.000000 1.403198 1.403198 0.000000 0.205086 0.410172 110175 0.205086 1.044450 3.133350 2.088900 0.056653 0.113306 0.056653 0.154384 0.463152 0.308768 0.075915 0.710454 0.639568 4.084938 0.000000 0.051575 0.000000 7.788963 7.788963 7.788963 8.168503 8.168503 8.168503 2.652734 1.249536 0.8676 0.2401 0.6232 1.0095 0.3864 0.0516 2.6527 0.0000 The averages in 036.036 are time 1.2495 averages, not simple averages


