

Question: problem 4 MATLAB Problem (4): Growth data of a sunflower plant is given in the following table 91 63 89 49 21 21 35 50
problem 4 MATLAB
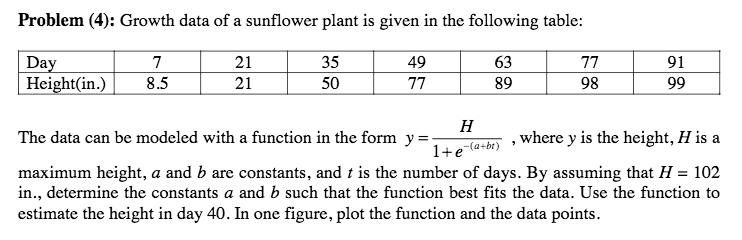
Problem (4): Growth data of a sunflower plant is given in the following table 91 63 89 49 21 21 35 50 98 Height(in.) 8.5 atb) , where y is the height, H isa The data can be modeled with a function in the form y = -(a+bt) maximum height, a and b are constants, and t is the number of days. By assuming that H 102 in., determine the constants a and b such that the function best fits the data. Use the function to estimate the height in day 40. In one figure, plot the function and the data points Problem (4): Growth data of a sunflower plant is given in the following table 91 63 89 49 21 21 35 50 98 Height(in.) 8.5 atb) , where y is the height, H isa The data can be modeled with a function in the form y = -(a+bt) maximum height, a and b are constants, and t is the number of days. By assuming that H 102 in., determine the constants a and b such that the function best fits the data. Use the function to estimate the height in day 40. In one figure, plot the function and the data points
Step by Step Solution
There are 3 Steps involved in it

Get step-by-step solutions from verified subject matter experts