

Question: Problem 4 . The following flowchart shows the main activities for processing on - line car insurance applications at an insurance company. Historical data indicate
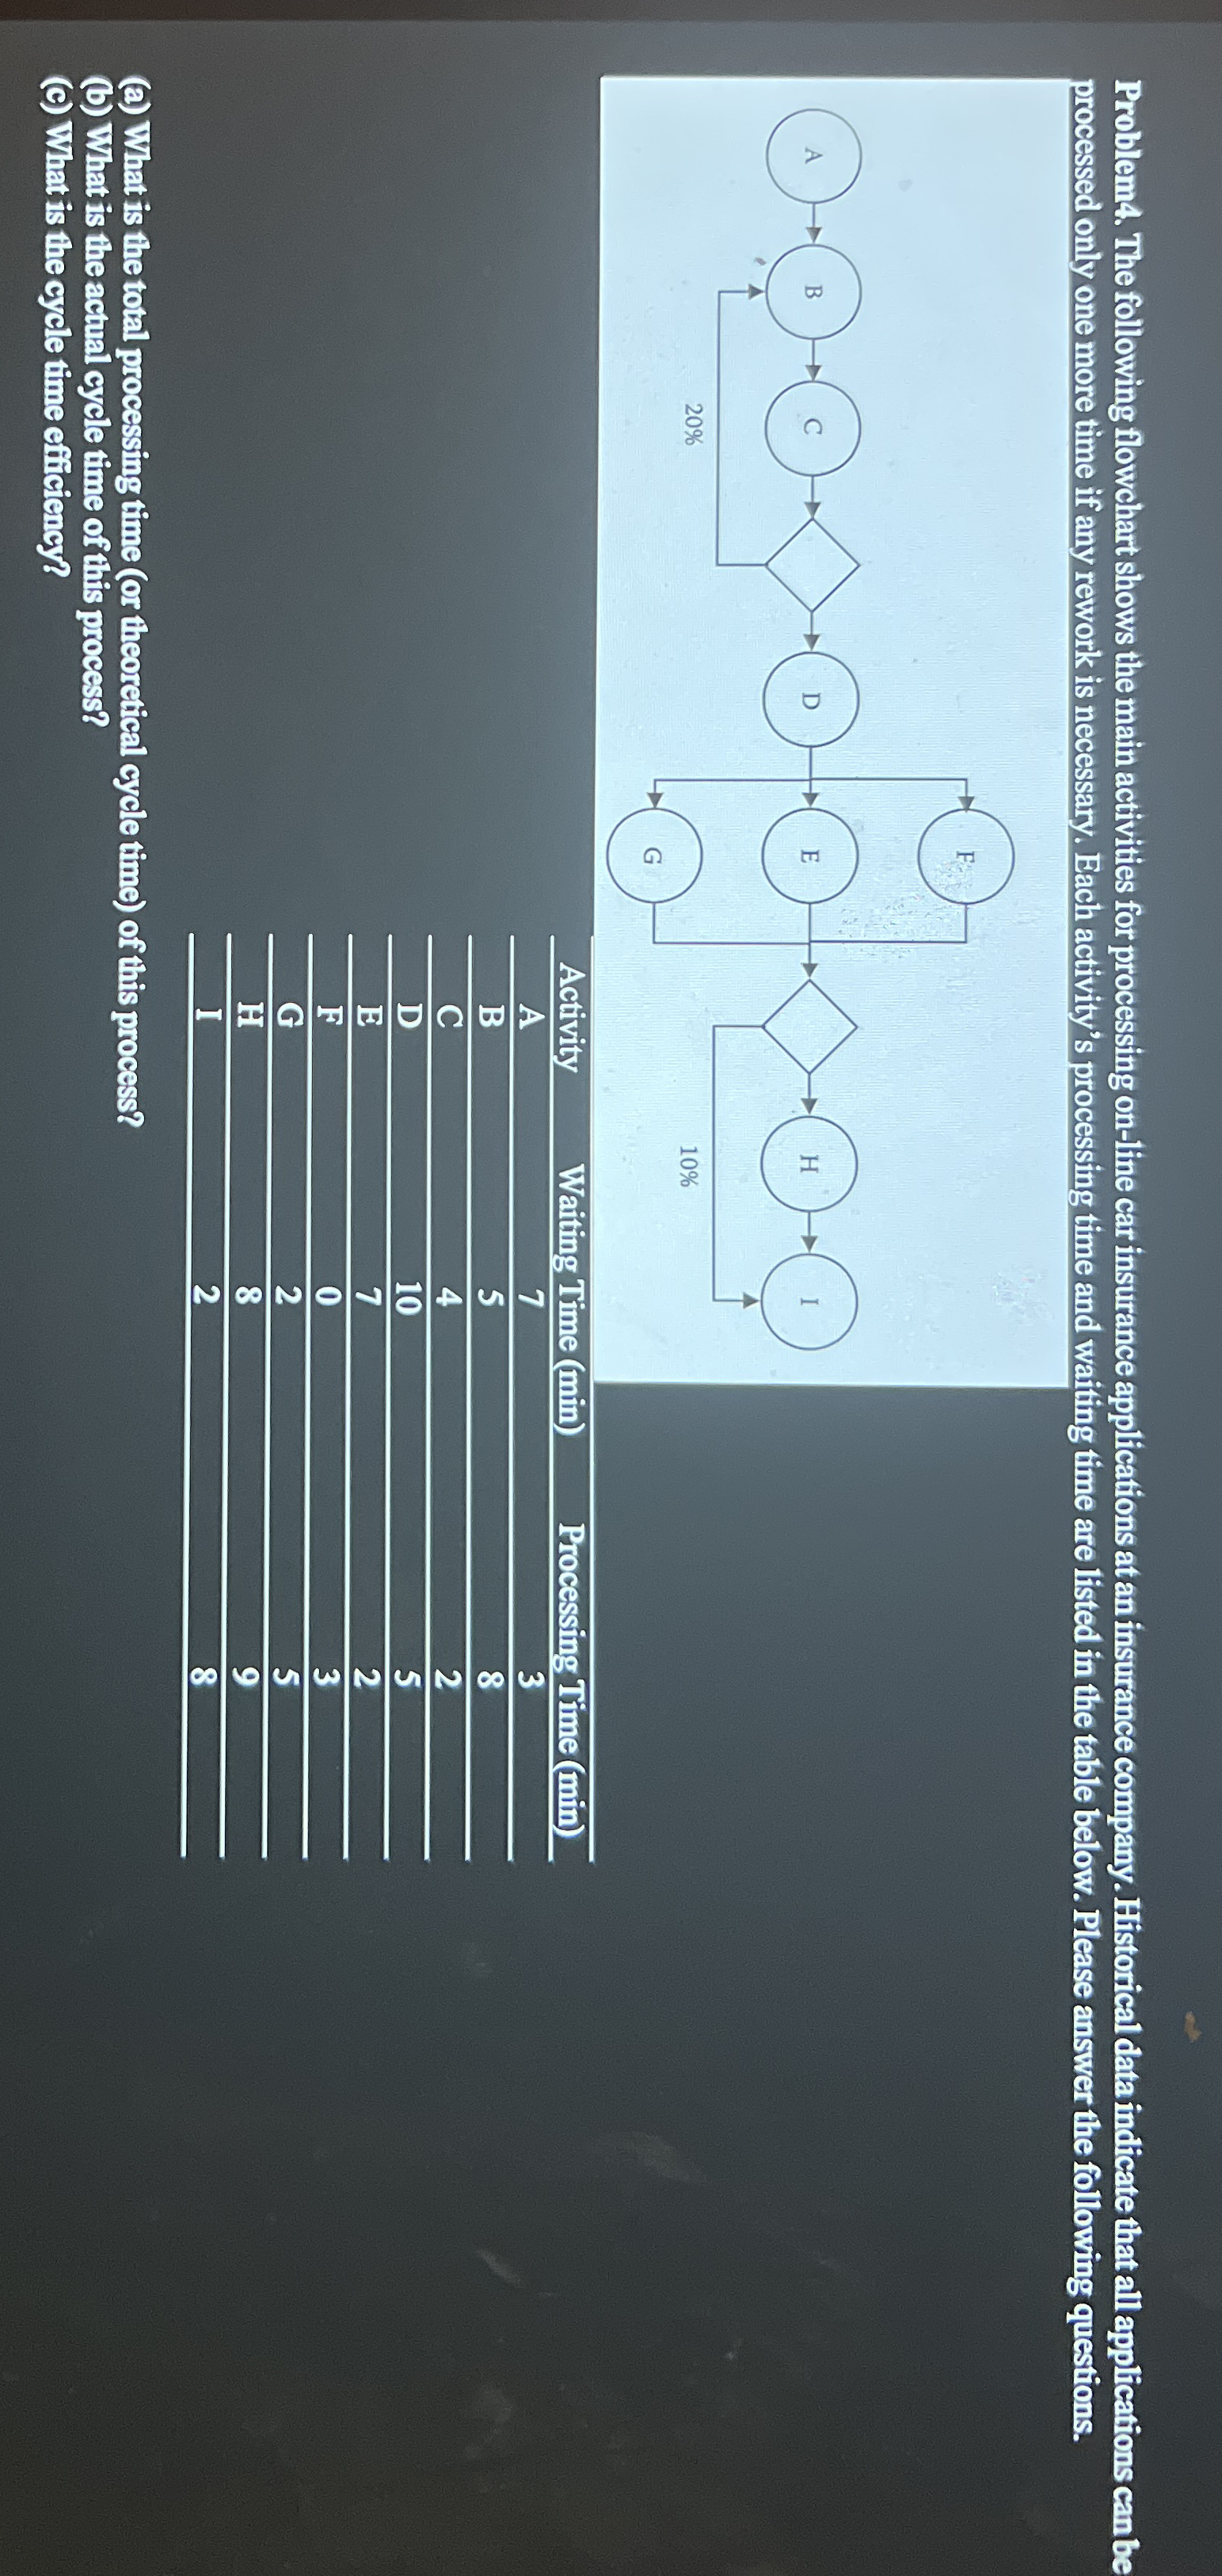
Problem The following flowchart shows the main activities for processing online car insurance applications at an insurance company. Historical data indicate that all applications can be processed only one more time if any rework is necessary. Each activity's processing time and waiting time are listed in the table below. Please answer the following questions.
tableActivityWaiting Time minProcessing TimeminABCDEFGHI
a What is the total processing time or theoretical cycle time of this process?
b What is the actual cycle time of this process?
c What is the cycle time efficiency?
Step by Step Solution
There are 3 Steps involved in it
1 Expert Approved Answer
Step: 1 Unlock

Question Has Been Solved by an Expert!
Get step-by-step solutions from verified subject matter experts
Step: 2 Unlock
Step: 3 Unlock