

Question: Problem #4 The following table shows measured data for Im versus V. GF-15 Sensor: Current vs. Voltage Measured voltage V. (mv) 1.51 2.73 4.21 6.33
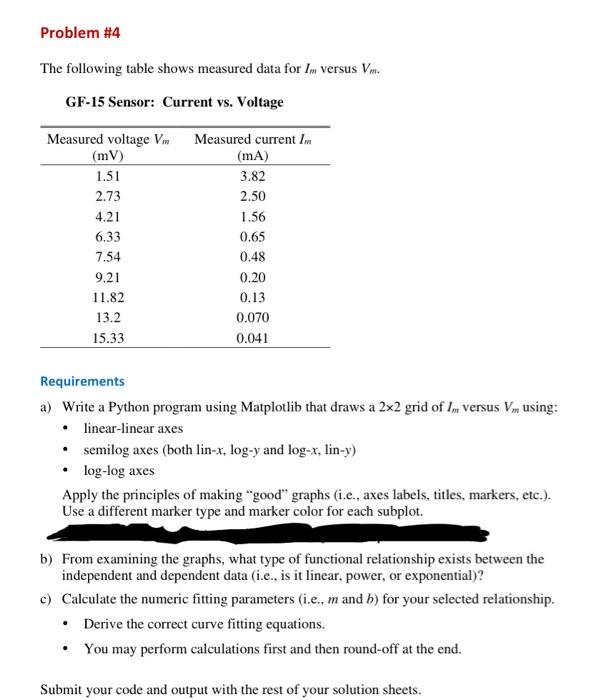
Problem #4 The following table shows measured data for Im versus V. GF-15 Sensor: Current vs. Voltage Measured voltage V. (mv) 1.51 2.73 4.21 6.33 7.54 9.21 11.82 13.2 15.33 Measured current Im (mA) 3.82 2.50 1.56 0.65 0.48 0.20 0.13 0.070 0.041 Requirements a) Write a Python program using Matplotlib that draws a 2x2 grid of . versus Vm using: linear-linear axes semilog axes (both lin-x, log-y and log-x, lin-y) log-log axes Apply the principles of making "good" graphs (i.e., axes labels, titles, markers, etc.). Use a different marker type and marker color for each subplot. b) From examining the graphs, what type of functional relationship exists between the independent and dependent data (i.e., is it linear, power, or exponential)? c) Calculate the numeric fitting parameters (i.e., m and b) for your selected relationship. Derive the correct curve fitting equations. You may perform calculations first and then round-off at the end. Submit your code and output with the rest of your solution sheets
Step by Step Solution
There are 3 Steps involved in it

Get step-by-step solutions from verified subject matter experts