

Question: Problem 4-41 Spreadsheet Problem (LG7) Oil prices have increased a great deal in the last decade. The table below shows the average oil price for
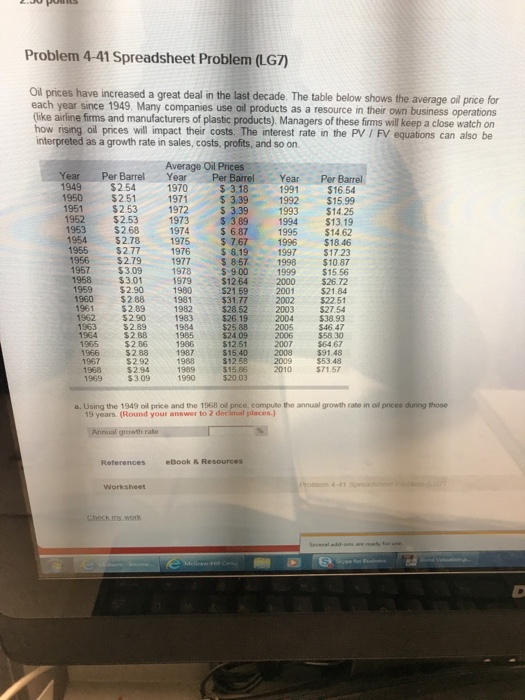
Problem 4-41 Spreadsheet Problem (LG7) Oil prices have increased a great deal in the last decade. The table below shows the average oil price for each year since 1949. Many companies use oil products as a resource in their own business operations like airline firms and manufacturers of plastic products). Managers of these firms will keep a close watch on how rising oil prices will impact their costs. The interest rate in the PV I FV equations can also be interpreted as a growth rate in sales, costs, profits, and so on. Average Oil Prices Year Per Barrel Year er Barrel Year 1991 1949 $2.54 $2.51 $2.53 1952$2.53 1970 $16.54 $ 3.39 S 3.39 $ 3.89 s 6.87 $ 7.67 $ 8.19 857 S 9.00 $12.64 $15.99 1993 $14.25 1992 1951 1972 1973 1974 1975 1976 1994 $13.19 1953 1995 1997 1999 $1462 $18.46 $17.23 $10.87 $2.77 S2.79 $3.09 $3.01 $2.90 $2.88 $2.89 $2.90 52.89 $2.88 1998 1957 1978 1979 2000 $26.72 $21.84 $22.51 $27.54 $38.93 1981 $31.77 1961 1962 1963 2003 1983 1984 2005 $24.09 $15.40 $15.86 558 30 1986 52.88 591.48 $53.48 1988 $2.94 $ 3 09 989 2010 1969 1990 520.03 a. Using the 1949 oil price and the 1968 oil price, compute the annual growth rate in ol prices duning those 19 years. (Round your answer to 2 decimal places.) Anrual growth rate eBook & Resources Worksheet Checkmy work everal add-ons
Step by Step Solution
There are 3 Steps involved in it

Get step-by-step solutions from verified subject matter experts