

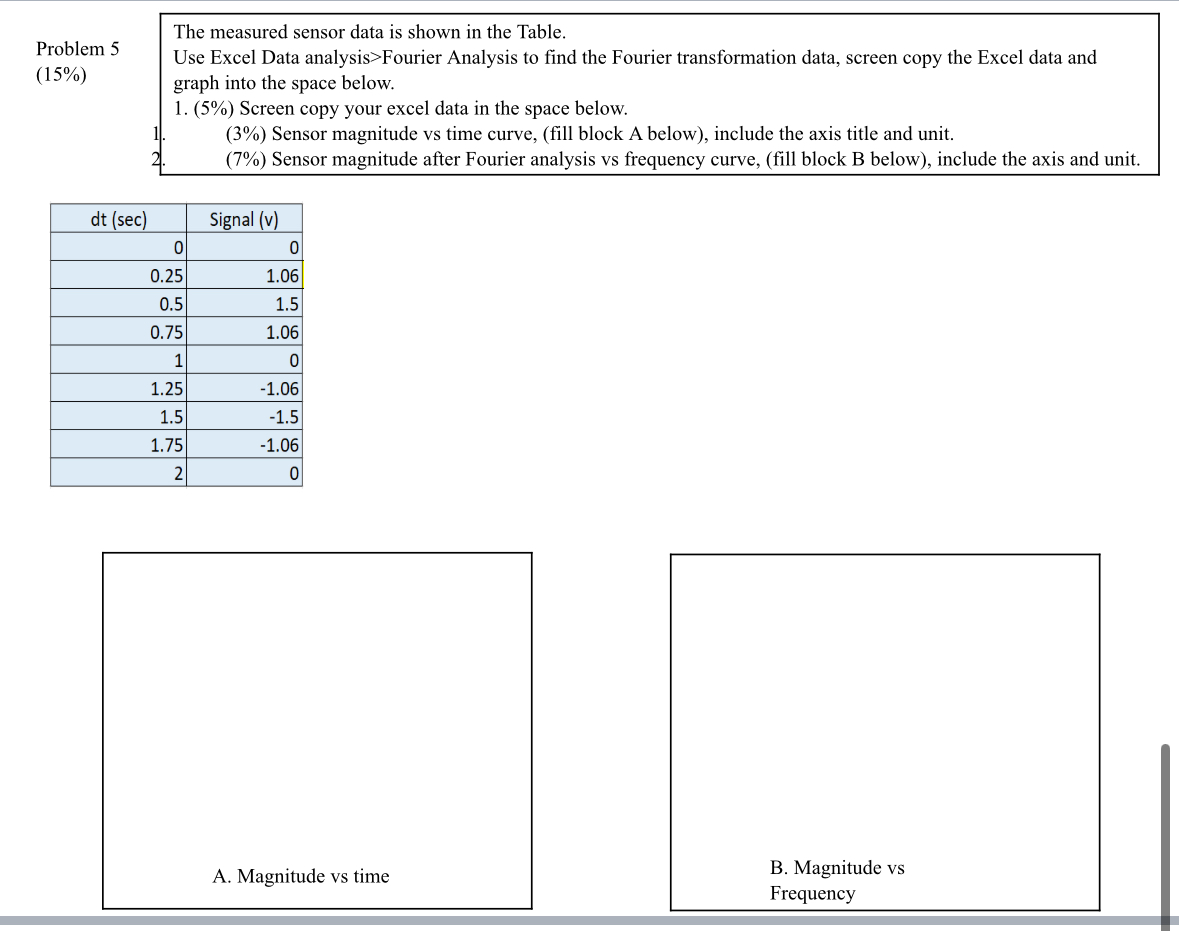
Question: Problem 5 ( 1 5 % ) The measured sensor data is shown in the Table. Use Excel Data analysis > Fourier Analysis to find
Problem
The measured sensor data is shown in the Table.
Use Excel Data analysisFourier Analysis to find the Fourier transformation data, screen copy the Excel data and graph into the space below.
Screen copy your excel data in the space below.
Sensor magnitude vs time curve, fill block A below include the axis title and unit.
Sensor magnitude after Fourier analysis vs frequency curve, fill block B below include the axis and unit.
tabledt secSignal v
Step by Step Solution
There are 3 Steps involved in it
1 Expert Approved Answer
Step: 1 Unlock

Question Has Been Solved by an Expert!
Get step-by-step solutions from verified subject matter experts
Step: 2 Unlock
Step: 3 Unlock