

Question: Problem 5 - 6 : Quarterly water usage i s shown below. ( P l e a s e calculate u p t o 4
Problem : Quarterly water usage shown below. calculate
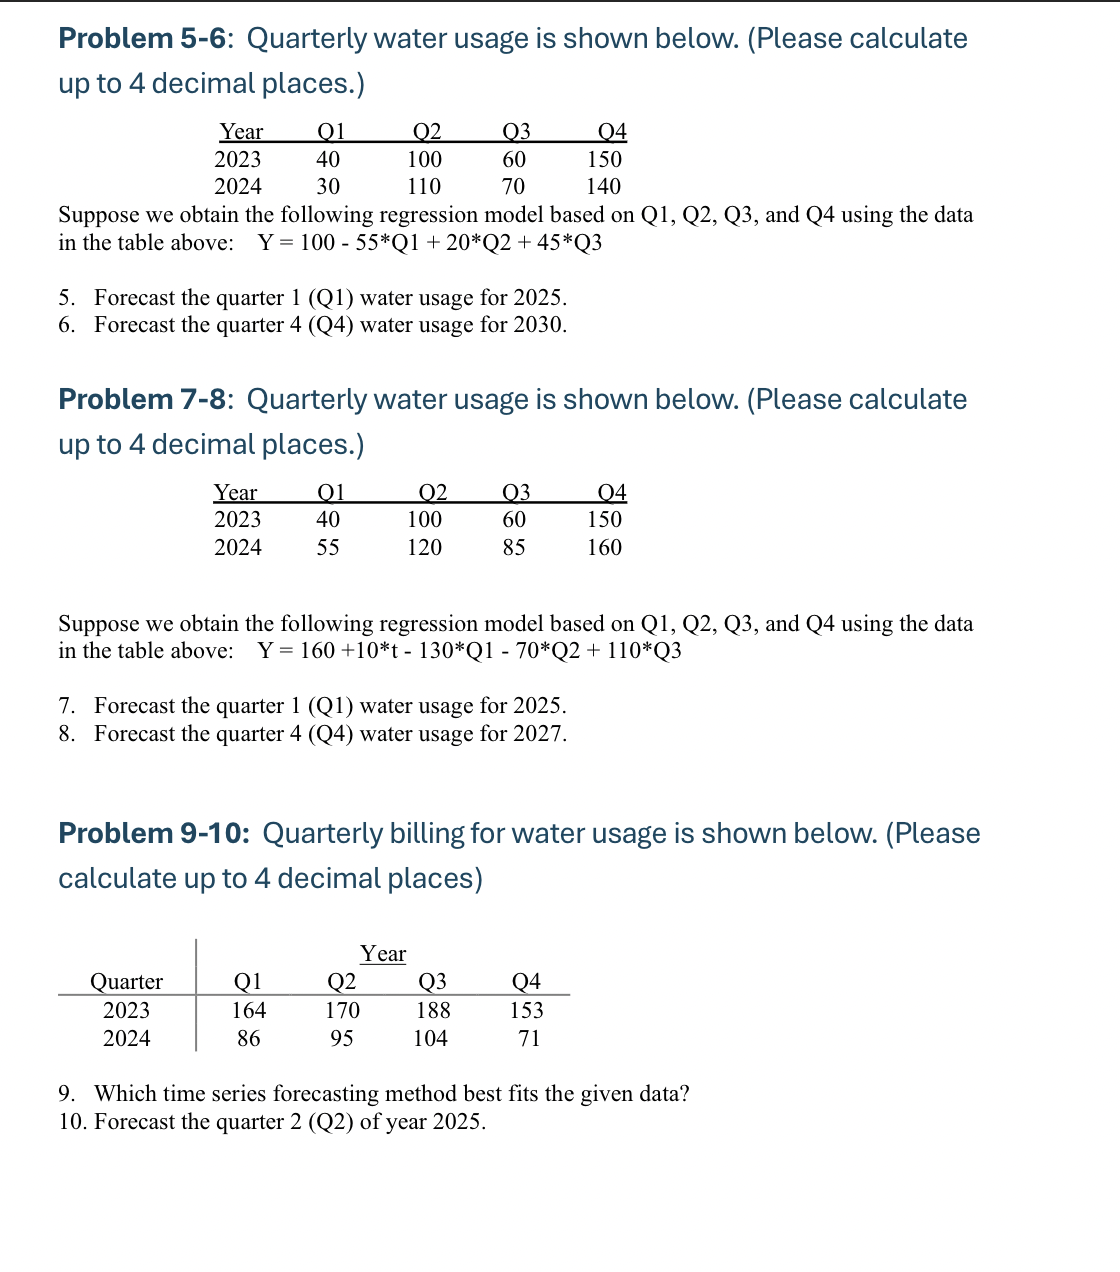
decimal places.
Suppose obtain the following regression model based and using the data
the table above:
Forecast the quarter water usage for
Forecast the quarter water usage for
Problem : Quarterly water usage shown below. calculate
decimal places.
Suppose obtain the following regression model based and using the data
the table above:
Forecast the quarter water usage for
Forecast the quarter water usage for
Problem : Quarterly billing for water usage shown below.
calculate decimal places
Which time series forecasting method best fits the given data?
Forecast the quarter year
Step by Step Solution
There are 3 Steps involved in it
1 Expert Approved Answer
Step: 1 Unlock

Question Has Been Solved by an Expert!
Get step-by-step solutions from verified subject matter experts
Step: 2 Unlock
Step: 3 Unlock