

Question: Problem 5 (a) Construct a frequency histogram with an initial grouping of 336 to 338 feet for the data collected in Problem 4. Total Stopping

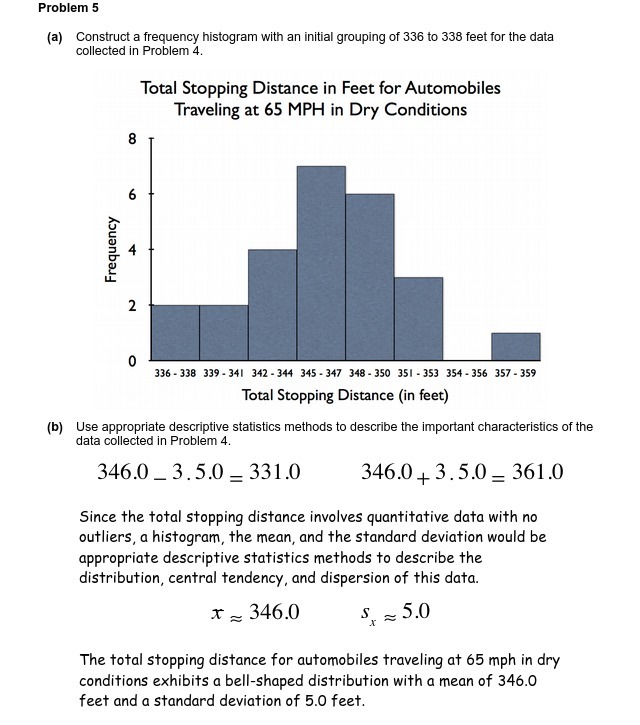
Problem 5 (a) Construct a frequency histogram with an initial grouping of 336 to 338 feet for the data collected in Problem 4. Total Stopping Distance in Feet for Automobiles Traveling at 65 MPH in Dry Conditions 6 Frequency 0 336 - 338 339 - 341 342 - 344 345 - 347 348 - 350 351 - 353 354 - 356 357 - 359 Total Stopping Distance (in feet) [b) Use appropriate descriptive statistics methods to describe the important characteristics of the data collected in Problem 4. 346.0 _3.5.0 - 331.0 346.0 3.5.0 _ 361.0 Since the total stopping distance involves quantitative data with no outliers, a histogram, the mean, and the standard deviation would be appropriate descriptive statistics methods to describe the distribution, central tendency, and dispersion of this data. x ~ 346.0 S = 5.0 The total stopping distance for automobiles traveling at 65 mph in dry conditions exhibits a bell-shaped distribution with a mean of 346.0 feet and a standard deviation of 5.0 feet
Step by Step Solution
There are 3 Steps involved in it

Get step-by-step solutions from verified subject matter experts