

Question: Problem 5 Consider the 2013 declined loan data from Lending Club titled RejectStatsB2013 from the Connect website. Similar to the analysis done in the chapter,
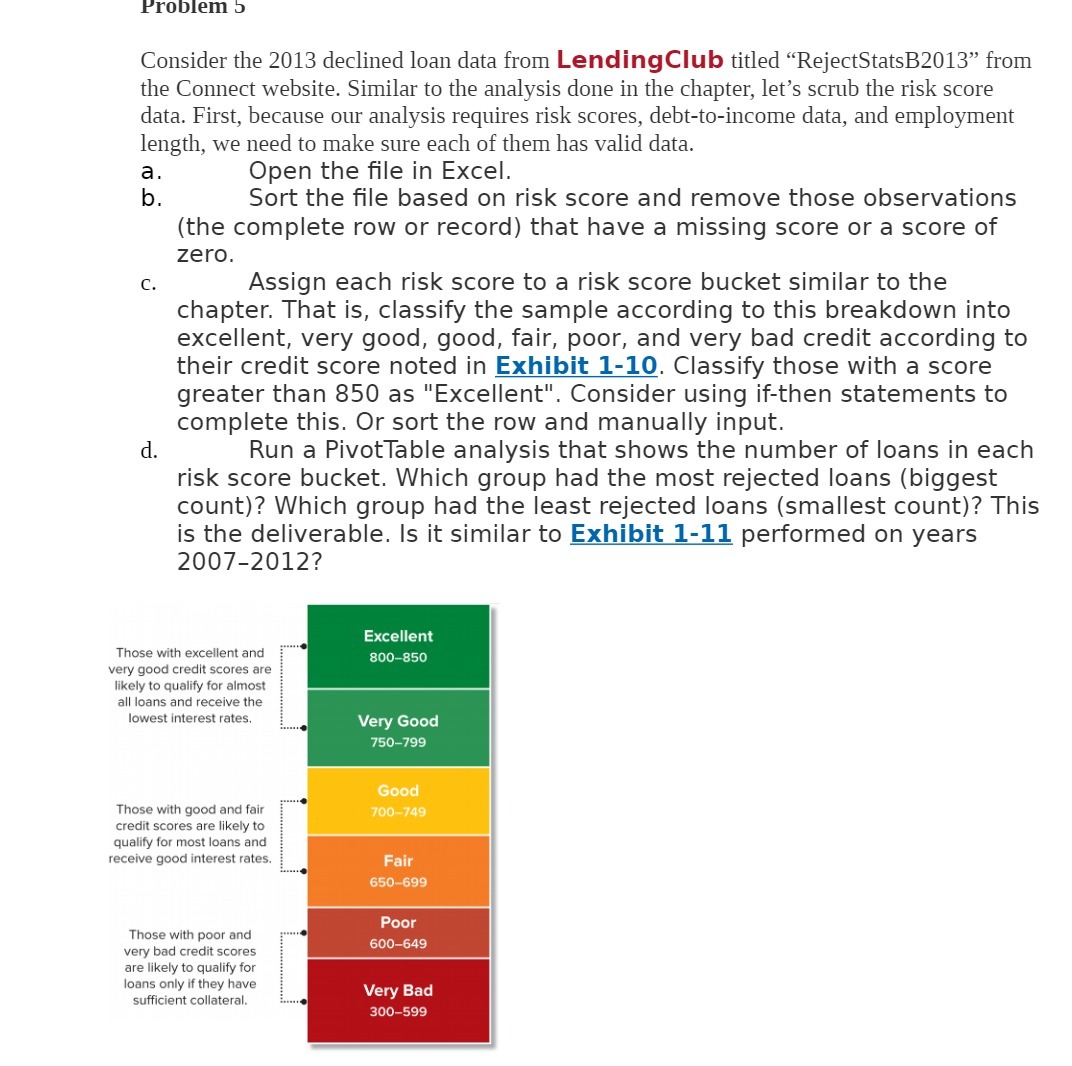
Problem 5 Consider the 2013 declined loan data from Lending Club titled "RejectStatsB2013" from the Connect website. Similar to the analysis done in the chapter, let's scrub the risk score data. First, because our analysis requires risk scores, debt-to-income data, and employment length, we need to make sure each of them has valid data. a Open the file in Excel. b. Sort the file based on risk score and remove those observations (the complete row or record) that have a missing score or a score of zero. C. Assign each risk score to a risk score bucket similar to the chapter. That is, classify the sample according to this breakdown into excellent, very good, good, fair, poor, and very bad credit according to their credit score noted in Exhibit 1-10. Classify those with a score greater than 850 as "Excellent". Consider using if-then statements to complete this. Or sort the row and manually input. d. Run a PivotTable analysis that shows the number of loans in each risk score bucket. Which group had the most rejected loans (biggest count)? Which group had the least rejected loans (smallest count)? This is the deliverable. Is it similar to Exhibit 1-11 performed on years 2007-2012? Excellent Those with excellent and very good credit scores are 800-850 likely to qualify for almost all loans and receive the lowest interest rates. Very Good 750-799 Good Those with good and fair 700-749 credit scores are likely to qualify for most loans and receive good interest rates. Fair 650-699 Those with poor and Poor very bad credit scores 600-649 are likely to qualify for loans only if they have sufficient collateral. Very Bad 300-599
Step by Step Solution
There are 3 Steps involved in it

Get step-by-step solutions from verified subject matter experts