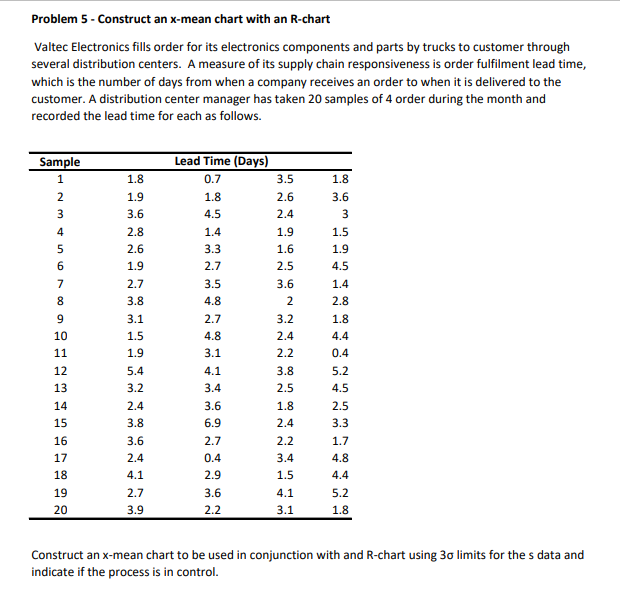
Question: Problem 5 - Construct an x-mean chart with an R-chart Valtec Electronics fills order for its electronics components and parts by trucks to customer through

Problem 5 - Construct an x-mean chart with an

Problem 5 - Construct an x-mean chart with an R-chart Valtec Electronics fills order for its electronics components and parts by trucks to customer through several distribution centers. A measure of its supply chain responsiveness is order fulfilment lead time, which is the number of days from when a company receives an order to when it is delivered to the customer. A distribution center manager has taken 20 samples of 4 order during the month and recorded the lead time for each as follows. 1.8 1.8 3.6 3 mil 2 w N Sample 1 2 3 4 5 6 7 8 9 10 11 1.9 3.6 2.8 2.6 1.9 2.7 3.8 3.1 1.5 1.9 Lead Time (Days) 0.7 3.5 1.8 2.6 4.5 2.4 1.4 1.9 3.3 1.6 2.7 2.5 3.5 3.6 4.8 2 2.7 3.2 N 4.8 3.1 4.1 3.4 5.4 3.2 #tmm o + 1.5 1.9 4.5 1.4 2.8 1.8 4.4 0.4 5.2 4.5 2.5 3.3 1.7 4.8 4.4 5.2 1.8 12 13 14 15 16 17 18 DO 2.4 3.8 3.6 2.4 4.1 2.7 3.9 2.4 2.2 3.8 2.5 1.8 2.4 2.2 3.4 1.5 4.1 3.1 3.6 6.9 2.7 0.4 2.9 3.6 2.2 19 20 Construct an x-mean chart to be used in conjunction with and R-chart using 30 limits for the s data and indicate if the process is in control

Step by Step Solution

There are 3 Steps involved in it

1 Expert Approved Answer
Step: 1 Unlock blur-text-image
Question Has Been Solved by an Expert!

Get step-by-step solutions from verified subject matter experts

Step: 2 Unlock
Step: 3 Unlock

Students Have Also Explored These Related General Management Questions!