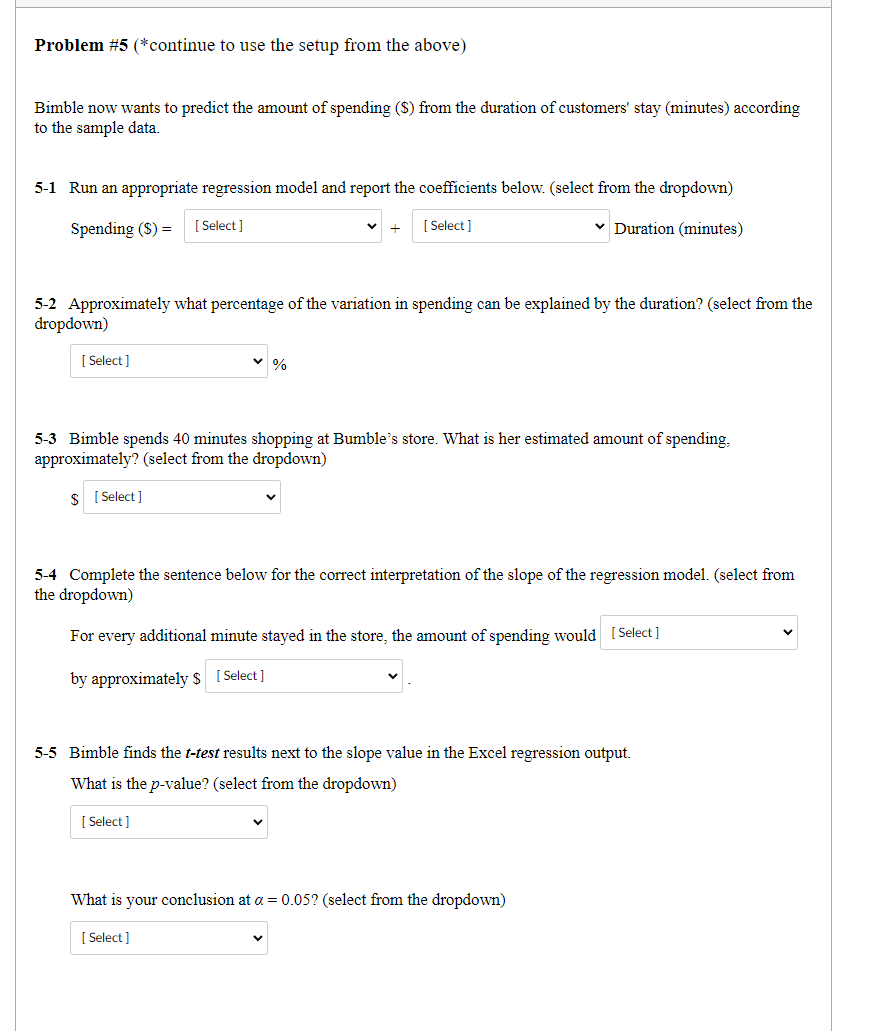
Question: Problem #5 (*continue to use the setup from the above) Bimble now wants to predict the amount of spending ($) from the duration of customers'

Problem #5 (*continue to use the setup from theProblem #5 (*continue to use the setup from theProblem #5 (*continue to use the setup from the

Problem #5 (*continue to use the setup from the above) Bimble now wants to predict the amount of spending ($) from the duration of customers' stay (minutes) according to the sample data. 5-1 Run an appropriate regression model and report the coefficients below. (select from the dropdown) Spending ($) = Select] Select] Duration (minutes) 5-2 Approximately what percentage of the variation in spending can be explained by the duration? (select from the dropdown) [Select] % 5-3 Bimble spends 40 minutes shopping at Bumbles store. What is her estimated amount of spending, approximately? (select from the dropdown) $ [Select] 5-4 Complete the sentence below for the correct interpretation of the slope of the regression model. (select from the dropdown) For every additional minute stayed in the store, the amount of spending would (Select] by approximately $ [Select] 5-5 Bimble finds the t-test results next to the slope value in the Excel regression output. What is the p-value? (select from the dropdown) Select ] What is your conclusion at a = 0.05? (select from the dropdown) [ Select ] Question 6 30 pts Problem #6 (*continue to use the setup from the above) Bumble, after watching Bimble's analysis, wants to predict the amount of spending ($) from customers' duration of stay (minutes), age (years), and gender (0 = male, 1 = female) according to the sample data. 6-1 Run an appropriate regression model and report the coefficients below. (select from the dropdown) *If a variable should not be used, select the number "O" (zero). Spending ($) = [Select] Select] Duration + Select] Age + [ Select] Gender + Select ] Travel + [ Select] Member 6-2 Bimble spends 40 minutes shopping at Bumble's store. She is 22 years old and has a membership at the store. What is her estimated amount of spending, approximately? (select from the dropdown) $ [Select] 6-3 Bumble finds a series of t-test results next to the slope values in the Excel regression output What can we conclude for each of the following variables according to the output at a = 0.05? Duration has [Select ] with the amount of spending while holding the other predictors constant. Age has (Select with the amount of spending while holding the other predictors constant. Travel has [Select] with the amount of spending while holding the other predictors constant. Duration (minute Age 21 N ID Spending (5) 1 65 26 3 44 31 5 5 6 95 7 12 125 4 4 31 33 9 47 No 35 00 43 7 9 9 8 0 10 No 18 49 11 0 12 B 13 14 61 36 48 57 56 15 Gender (O=male Travel (minutes) Dietary Preferen Member? 18 0 15 Regular Yes 25 0 20 Regular No 17 0 15 Regular No 48 0 10 Low-carb 28 0 25 Low-fat Yes 55 0 40 Regular No 33 0 20 Low-fat Yes 51 0 35 Low-carb No 25 5 Regular Yes 32 0 10 Low-carb 29 25 Regular No 28 0 50 Regular No 30 0 15 Low-carb No 19 0 60 Low-fat No 62 0 10 Low-carb No 30 35 Low-fat Yes 40 1 70 Regular Yes 51 1 25 Low-carb No 45 1 30 Low-fat Yes 68 1 5 Low-fat Yes 29 10 Low-carb Yes 30 30 Low-fat No 47 1 45 Low-carb Yes 33 1 20 Regular Yes 90 15 Low-carb No 16 30 Low-fat Yes 43 40 Low-carb Yes 36 60 Low-fat Yes 71 1 45 Regular Yes 48 1 20 Low-fat No 16 1 17 68 85 80 102 89 68 122 73 188 256 113 88 188 76 197 99 238 47 18 47 53 19 20 21 1 22 1 39 57 27 67 30 61 23 24 25 1 26 52 1 27 166 26 1 28 1 85 159 200 51 64 29 30 50 Problem #5 (*continue to use the setup from the above) Bimble now wants to predict the amount of spending ($) from the duration of customers' stay (minutes) according to the sample data. 5-1 Run an appropriate regression model and report the coefficients below. (select from the dropdown) Spending ($) = Select] Select] Duration (minutes) 5-2 Approximately what percentage of the variation in spending can be explained by the duration? (select from the dropdown) [Select] % 5-3 Bimble spends 40 minutes shopping at Bumbles store. What is her estimated amount of spending, approximately? (select from the dropdown) $ [Select] 5-4 Complete the sentence below for the correct interpretation of the slope of the regression model. (select from the dropdown) For every additional minute stayed in the store, the amount of spending would (Select] by approximately $ [Select] 5-5 Bimble finds the t-test results next to the slope value in the Excel regression output. What is the p-value? (select from the dropdown) Select ] What is your conclusion at a = 0.05? (select from the dropdown) [ Select ] Question 6 30 pts Problem #6 (*continue to use the setup from the above) Bumble, after watching Bimble's analysis, wants to predict the amount of spending ($) from customers' duration of stay (minutes), age (years), and gender (0 = male, 1 = female) according to the sample data. 6-1 Run an appropriate regression model and report the coefficients below. (select from the dropdown) *If a variable should not be used, select the number "O" (zero). Spending ($) = [Select] Select] Duration + Select] Age + [ Select] Gender + Select ] Travel + [ Select] Member 6-2 Bimble spends 40 minutes shopping at Bumble's store. She is 22 years old and has a membership at the store. What is her estimated amount of spending, approximately? (select from the dropdown) $ [Select] 6-3 Bumble finds a series of t-test results next to the slope values in the Excel regression output What can we conclude for each of the following variables according to the output at a = 0.05? Duration has [Select ] with the amount of spending while holding the other predictors constant. Age has (Select with the amount of spending while holding the other predictors constant. Travel has [Select] with the amount of spending while holding the other predictors constant. Duration (minute Age 21 N ID Spending (5) 1 65 26 3 44 31 5 5 6 95 7 12 125 4 4 31 33 9 47 No 35 00 43 7 9 9 8 0 10 No 18 49 11 0 12 B 13 14 61 36 48 57 56 15 Gender (O=male Travel (minutes) Dietary Preferen Member? 18 0 15 Regular Yes 25 0 20 Regular No 17 0 15 Regular No 48 0 10 Low-carb 28 0 25 Low-fat Yes 55 0 40 Regular No 33 0 20 Low-fat Yes 51 0 35 Low-carb No 25 5 Regular Yes 32 0 10 Low-carb 29 25 Regular No 28 0 50 Regular No 30 0 15 Low-carb No 19 0 60 Low-fat No 62 0 10 Low-carb No 30 35 Low-fat Yes 40 1 70 Regular Yes 51 1 25 Low-carb No 45 1 30 Low-fat Yes 68 1 5 Low-fat Yes 29 10 Low-carb Yes 30 30 Low-fat No 47 1 45 Low-carb Yes 33 1 20 Regular Yes 90 15 Low-carb No 16 30 Low-fat Yes 43 40 Low-carb Yes 36 60 Low-fat Yes 71 1 45 Regular Yes 48 1 20 Low-fat No 16 1 17 68 85 80 102 89 68 122 73 188 256 113 88 188 76 197 99 238 47 18 47 53 19 20 21 1 22 1 39 57 27 67 30 61 23 24 25 1 26 52 1 27 166 26 1 28 1 85 159 200 51 64 29 30 50

Step by Step Solution

There are 3 Steps involved in it

1 Expert Approved Answer
Step: 1 Unlock blur-text-image
Question Has Been Solved by an Expert!

Get step-by-step solutions from verified subject matter experts

Step: 2 Unlock
Step: 3 Unlock

Students Have Also Explored These Related General Management Questions!