

Question: Problem 5 Using the forecasts determined from Problems 1 b , 2 , 3 , and 4 a . For Year 2 , graph the
Problem
Using the forecasts determined from Problems b and
a For Year graph the actual and forecasted values using the five techniques used in problems
and nave previous period, nave previous year, moving average, weighted moving average,
and exponential smoothing Label all axes. You can draw this graph by hand or use Excel.
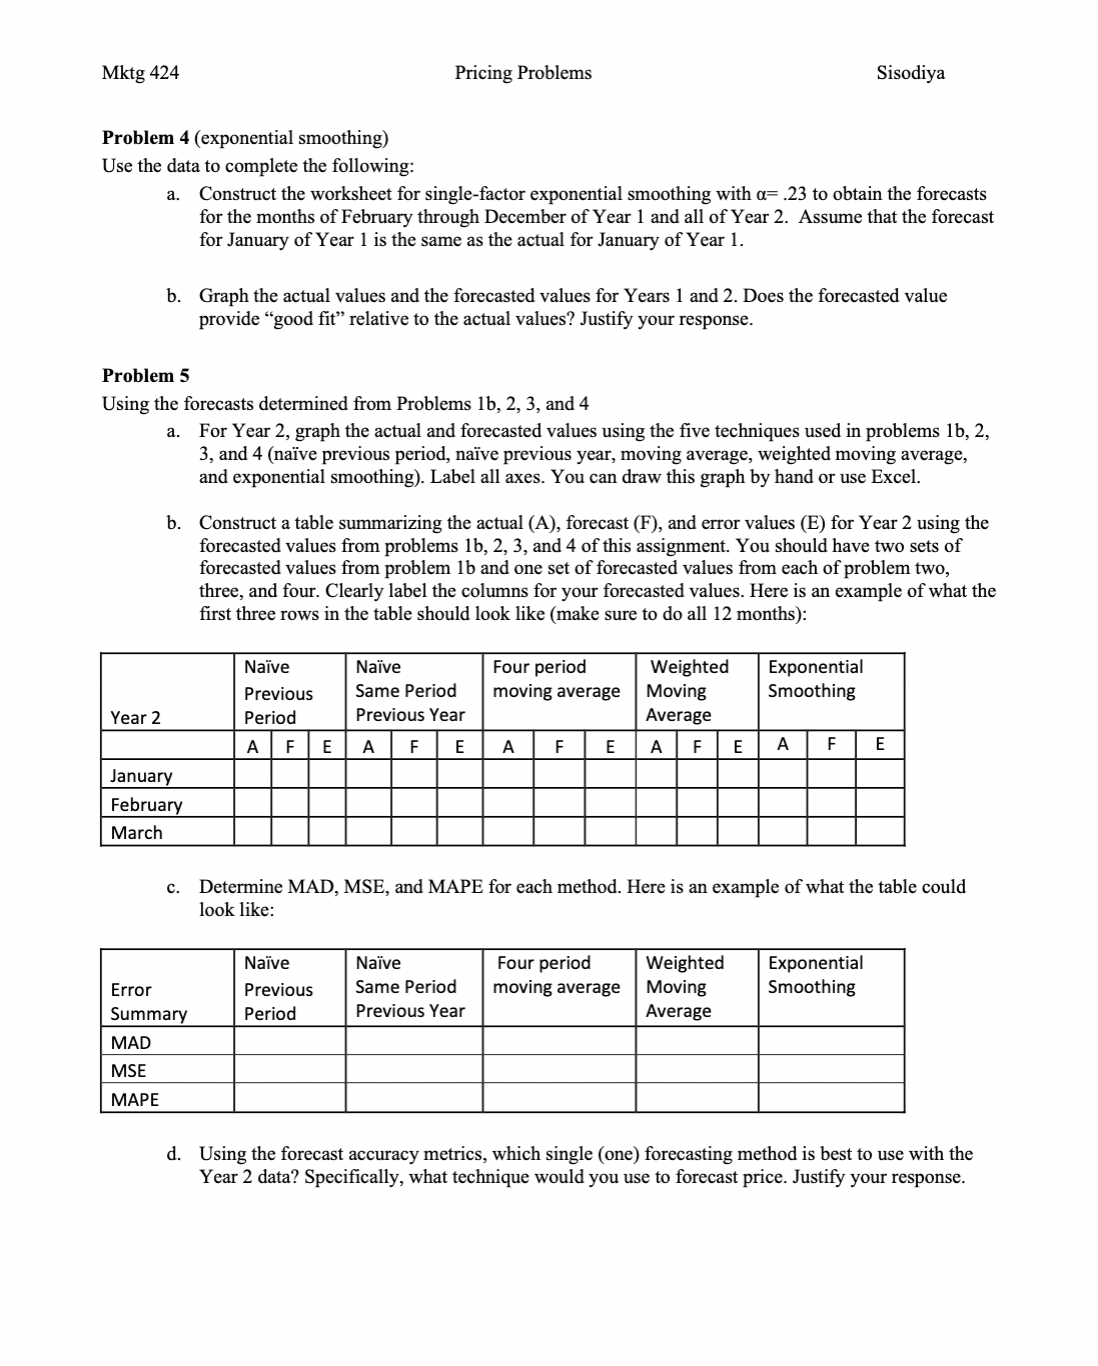
b Construct a table summarizing the actual A forecast F and error values E for Year using the
forecasted values from problems and of this assignment. You should have two sets of
forecasted values from problem b and one set of forecasted values from each of problem two,
three, and four. Clearly label the columns for your forecasted values. Here is an example of what the
first three rows in the table should look like make sure to do all months:
c Determine MAD, MSE, and MAPE for each method. Here is an example of what the table could
look like:
d Using the forecast accuracy metrics, which single one forecasting method is best to use with the
Year data? Specifically, what technique would you use to forecast price. Justify your response.
Step by Step Solution
There are 3 Steps involved in it
1 Expert Approved Answer
Step: 1 Unlock

Question Has Been Solved by an Expert!
Get step-by-step solutions from verified subject matter experts
Step: 2 Unlock
Step: 3 Unlock