

Question: ---------------------------------------- Problem 50E: Chapter: CH3 Problem: 50E In a university where calculus is a prerequisite for the statistics course, a sample of 15 students was
----------------------------------------
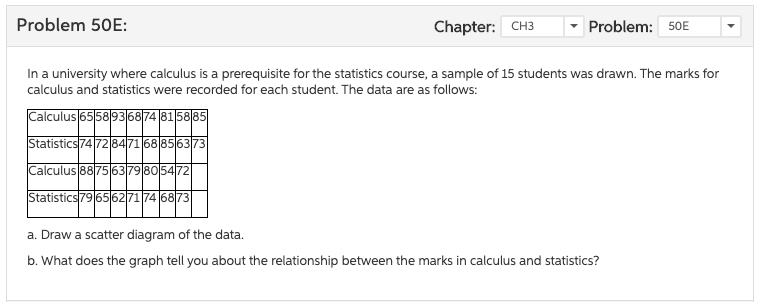
Problem 50E: Chapter: CH3 Problem: 50E In a university where calculus is a prerequisite for the statistics course, a sample of 15 students was drawn. The marks for calculus and statistics were recorded for each student. The data are as follows: Calculus 65 58 93 6874 81 58 85 Statistics 74 72 8471 68 85 6373 Calculus 88 75 6379 805472 Statistics 79 65 62 71 74 6873 a. Draw a scatter diagram of the data. b. What does the graph tell you about the relationship between the marks in calculus and statistics
Step by Step Solution
There are 3 Steps involved in it
1 Expert Approved Answer
Step: 1 Unlock

Question Has Been Solved by an Expert!
Get step-by-step solutions from verified subject matter experts
Step: 2 Unlock
Step: 3 Unlock