

Question: Problem 5-1 Name: 5&P 500 Date Index 2. Forecast 1. Create a Scatterplot and add a linear trend li 4-Jan-12 1,277.30 to Display Equation on
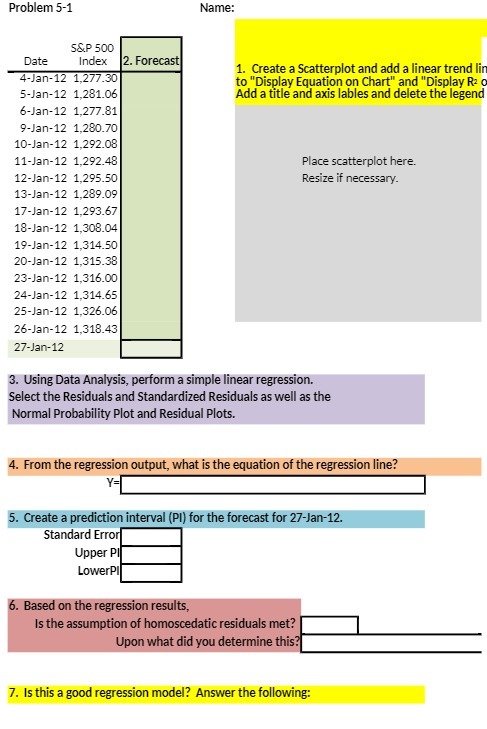

Problem 5-1 Name: 5&P 500 Date Index 2. Forecast 1. Create a Scatterplot and add a linear trend li 4-Jan-12 1,277.30 to "Display Equation on Chart" and "Display Ra 5-Jan-12 1,281.06 Add a title and axis lables and delete the legend 6-Jan-12 1,277.81 9-Jan-12 1,280.70 10-Jan-12 1,292.08 11-Jan-12 1,292.48 Place scatterplot here. 12-Jan-12 1,295.50 Resize if necessary. 13-Jan-12 1,289.09 17-Jan-12 1,293.67 18-Jan-12 1,308.04 19-Jan-12 1,314.50 20-Jan-12 1,315.38 23-Jan-12 1,316.00 24-Jan-12 1,314.65 25-Jan-12 1,326.06 26-Jan-12 1,318.43 27-Jan-12 3. Using Data Analysis, perform a simple linear regression. Select the Residuals and Standardized Residuals as well as the Normal Probability Plot and Residual Plots. 4. From the regression output, what is the equation of the regression line? Y= 5. Create a prediction interval (PI) for the forecast for 27-Jan-12. Standard Error Upper PI LowerP 6. Based on the regression results, Is the assumption of homoscedaric residuals met? Upon what did you determine this? 7. Is this a good regression model? Answer the following
Step by Step Solution
There are 3 Steps involved in it

Get step-by-step solutions from verified subject matter experts