

Question: Problem 5.1 Table 5.6 gives the experimental data obtained for an HDPE (melt density of 0.745gm/cm3 ) at 200C using a continuous-flow capillary rheometer for
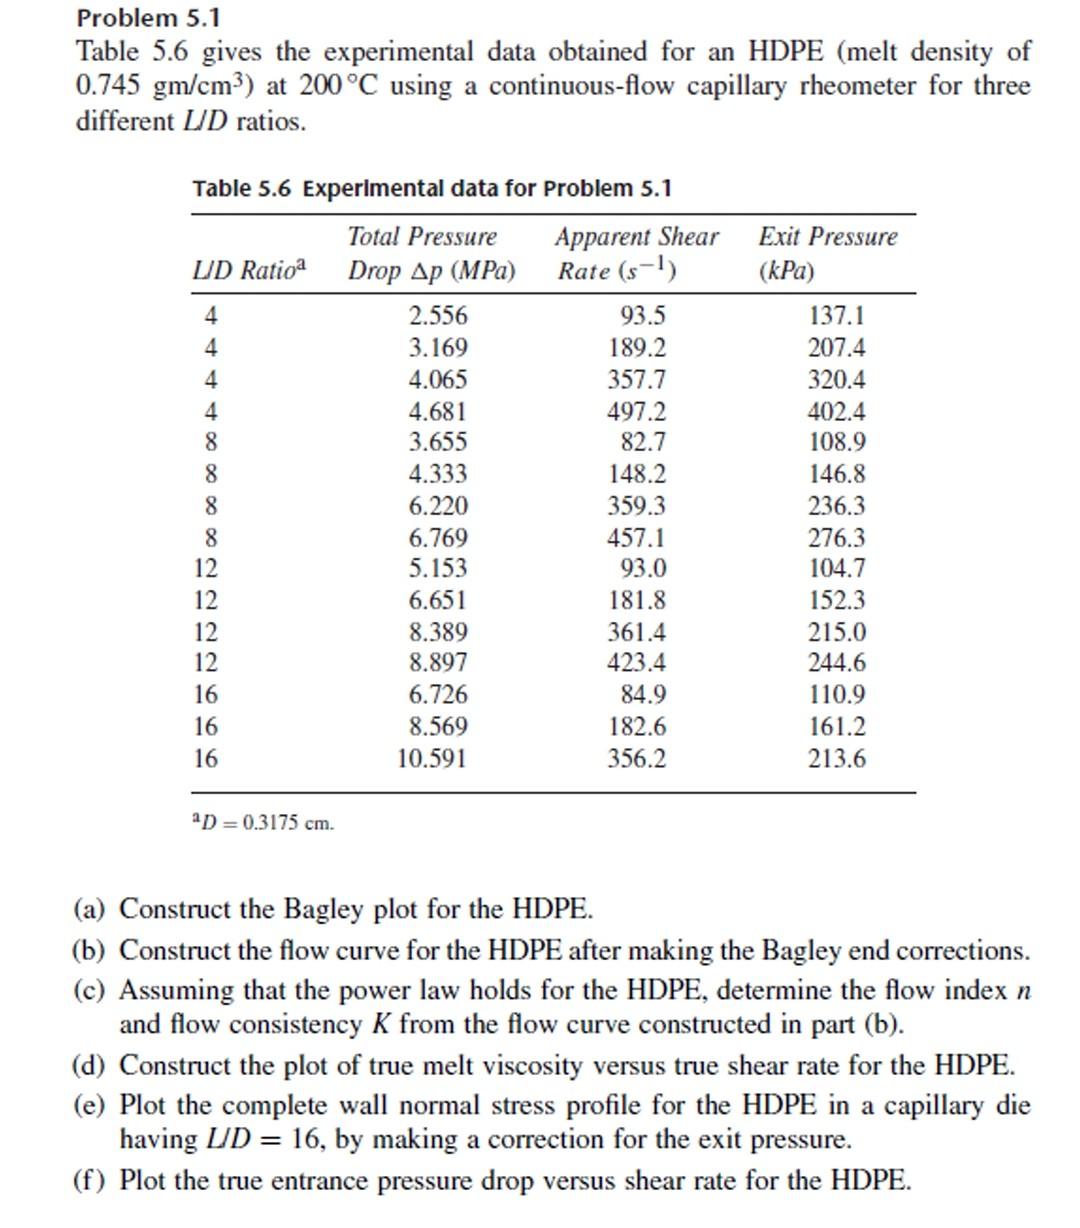
Problem 5.1 Table 5.6 gives the experimental data obtained for an HDPE (melt density of 0.745gm/cm3 ) at 200C using a continuous-flow capillary rheometer for three different LD ratios. Table 5.6 Exnerimental data for Prohlem 5.1 nD=0.51/2cm. (a) Construct the Bagley plot for the HDPE. (b) Construct the flow curve for the HDPE after making the Bagley end corrections. (c) Assuming that the power law holds for the HDPE, determine the flow index n and flow consistency K from the flow curve constructed in part (b). (d) Construct the plot of true melt viscosity versus true shear rate for the HDPE. (e) Plot the complete wall normal stress profile for the HDPE in a capillary die having LD=16, by making a correction for the exit pressure. (f) Plot the true entrance pressure drop versus shear rate for the HDPE
Step by Step Solution
There are 3 Steps involved in it

Get step-by-step solutions from verified subject matter experts