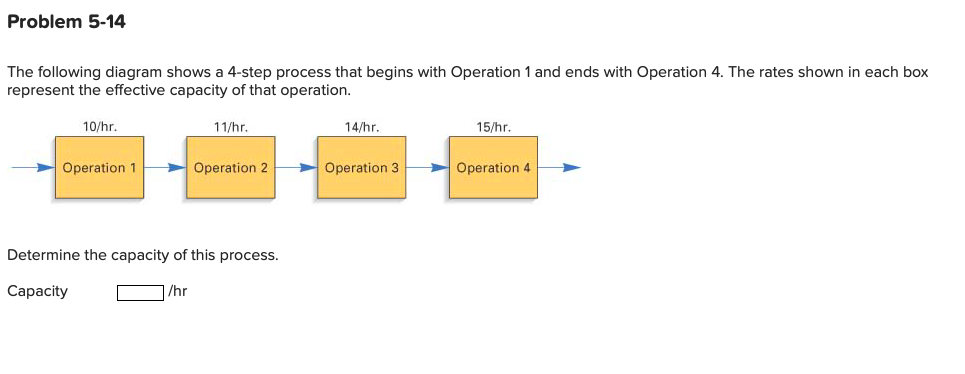
Question: Problem 5-14 The following diagram shows a 4-step process that begins with Operation 1 and ends with Operation 4. The rates shown in each box

Problem 5-14 The following diagram shows a 4-step

Problem 5-14 The following diagram shows a 4-step process that begins with Operation 1 and ends with Operation 4. The rates shown in each box represent the effective capacity of that operation. 10/hr. 11/hr. 14/hr. 15/hr. Operation 1 Operation 2 Operation 3 Operation 4 Determine the capacity of this process. Capacity O /hr

Step by Step Solution

There are 3 Steps involved in it

1 Expert Approved Answer
Step: 1 Unlock blur-text-image
Question Has Been Solved by an Expert!

Get step-by-step solutions from verified subject matter experts

Step: 2 Unlock
Step: 3 Unlock

Students Have Also Explored These Related General Management Questions!