

Question: Problem 5.4 Problems had the values in the following table for the 4-vear Your portfolio te your average return over the 4-year period. LG 1PS.1
Problem 5.4
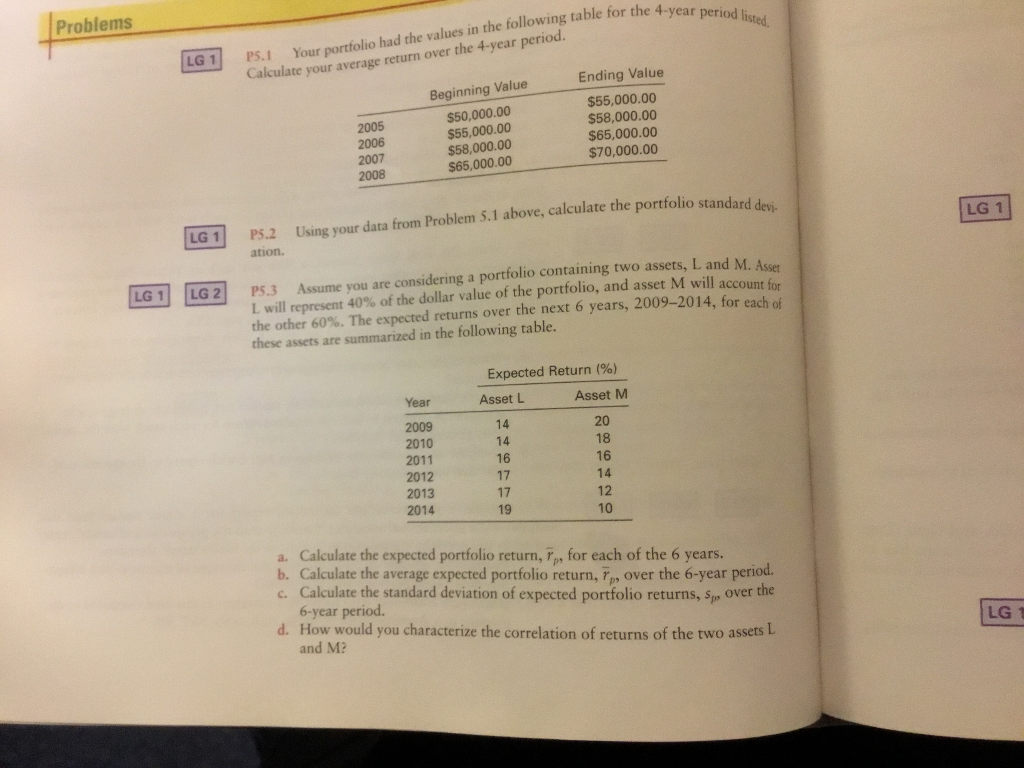
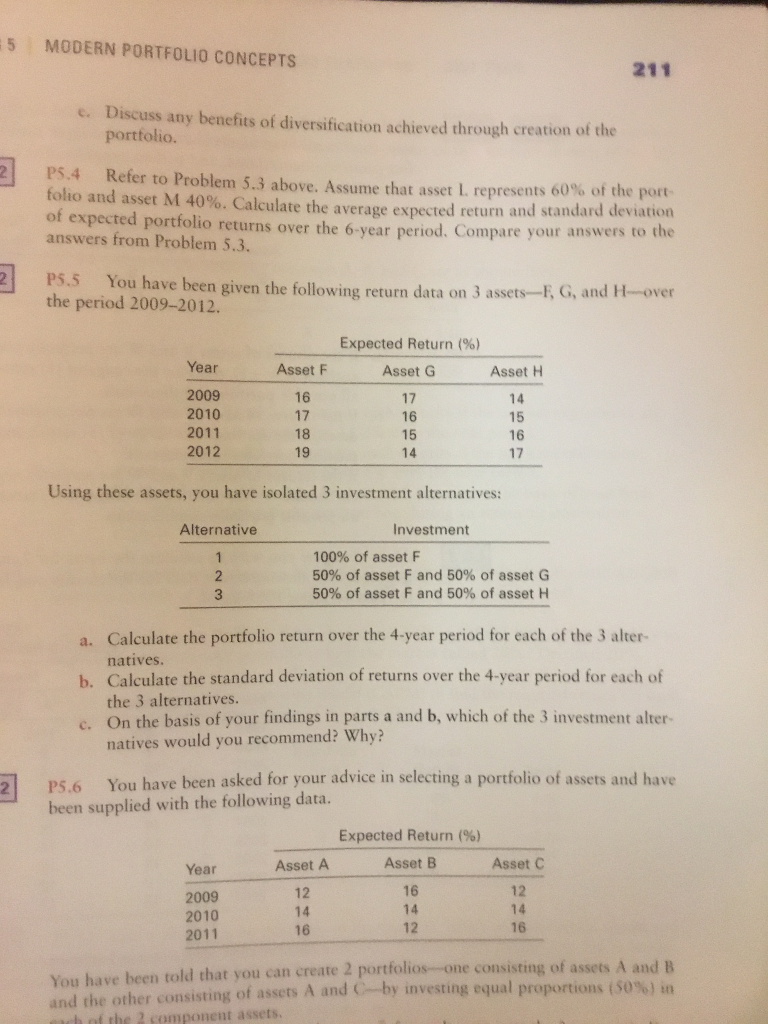
Problems had the values in the following table for the 4-vear Your portfolio te your average return over the 4-year period. LG 1PS.1 2005 2006 2007 2008 Beginning Value $50,000.00 $55,000.00 $58,000.00 $65,000.00 Ending Value $55,000.00 $58,000.00 $65,000.00 $70,000.00 LG1 P5.2 Using your data from Problem S.1 above, calculate the portfolio standard LG 1 ation. PS3 Assume you are considering a portfolio containing two assets, L and M. Ase L will represent 40% of the dollar value of the portfolio, and asset M will account for the other 60%. The expected returns over the next 6 years, 2009-2014, for each of LG1 LG 2 these assets are summarized in the following table. Expected Return (%) Year Asset L Asset M 2009 2010 2011 2012 2013 2014 14 14 16 17 17 19 20 18 16 14 12 10 a. Calculate the expected portfolio return, Tp, for each of the 6 years. b. Calculate the average expected portfolio return, 7p, over the 6-year period c. Calculate the standard deviation of expected portfolio returns, sp over the 6-year period. d. How would you characterize the correlation of returns of the two assets L LG T and M
Step by Step Solution
There are 3 Steps involved in it

Get step-by-step solutions from verified subject matter experts