

Question: Problem 5-67 (Static) High-Low Method, Data Visualization, Issues With Data (LO 5-1, 2, 5) Mendota Foods sells a variety of food products around the world.
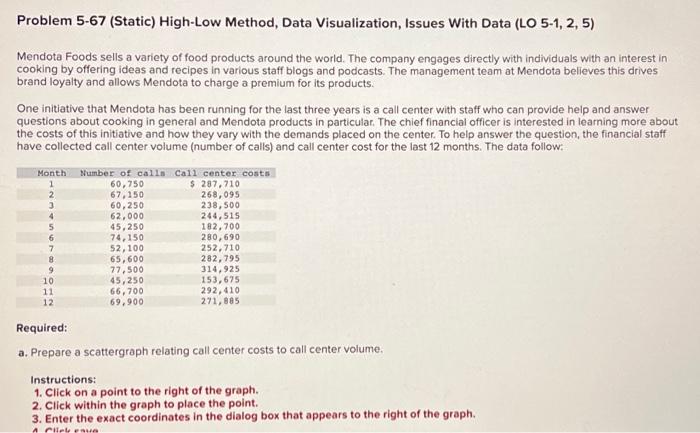
Problem 5-67 (Static) High-Low Method, Data Visualization, Issues With Data (LO 5-1, 2, 5) Mendota Foods sells a variety of food products around the world. The company engages directly with individuals with an interest in cooking by offering ideas and recipes in various staff blogs and podcasts. The management team at Mendota believes this drives brand loyalty and allows Mendota to charge a premium for its products. One initiative that Mendota has been running for the last three years is a call center with staff who can provide help and answer questions about cooking in general and Mendota products in particular. The chief financial officer is interested in learning more about the costs of this initiative and how they vary with the demands placed on the center. To help answer the question, the financial staff have collected call center volume (number of calls) and call center cost for the last 12 months. The data follow: Required: a. Prepare a scattergraph relating call center costs to call center volume. Instructions: 1. Click on a point to the right of the graph. 2 . Click within the graph to place the point. 3. Enter the exact coordinates in the dialog box that appears to the right of the graph. b. Using the high-low method, estimate call center costs for a month when call center volume is expected to be 62,250 calls. Note: Do not round intermediate calculations and round your final answer to nearest whole dollar amount
Step by Step Solution
There are 3 Steps involved in it

Get step-by-step solutions from verified subject matter experts