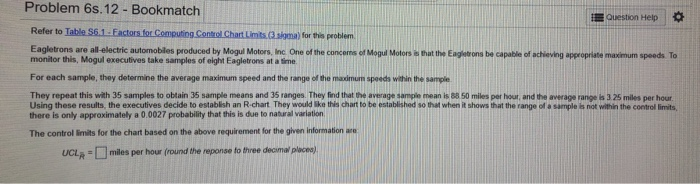
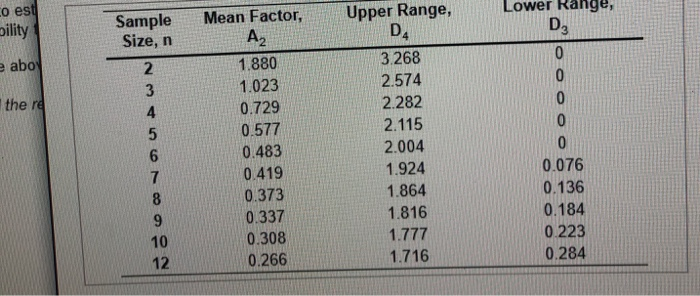
Question: Problem 6s.12 - Bookmatch Question Help Refer to Table $6.1. Factors for Computing Control Chart Limts (sima) for this problem Eagletrons are all electric automobiles

Problem 6s.12 - Bookmatch Question Help Refer to
Problem 6s.12 - Bookmatch Question Help Refer to Table $6.1. Factors for Computing Control Chart Limts (sima) for this problem Eagletrons are all electric automobiles produced by Mogul Motors, Inc One of the concerns of Mogul Motors is that the Eagletrons be capable of achieving appropriate maximum speeds To monitor this, Mogul executives take samples of eight Eagletrons at a time For each sample, they determine the average maximum speed and the range of the maximum speeds within the sample They repeat this with 35 samples to obtain 35 sample means and 35 ranges. They find that the average sample mean is 8850 miles per hour, and the average range is 3 25 miles per hour Using these results, the executives decide to establish an R.chart They would like this chart to be established so that when it shows that the range of a sample is not within the control limits, there is only approximately a 0.0027 probability that this is due to natural variation The controllimits for the chart based on the above requirement for the given information UCLX-miles per hour (round the reponse to three decimal plona) co est bility Sample Size, n aboy the re Mean Factor, A2 1.880 1.023 0.729 0.577 0.483 0.419 0.373 0.337 0.308 0.266 3 4 5 6 7 8 9 10 12 Upper Range, D 3.268 2.574 2.282 2.115 2.004 1.924 1.864 1.816 1.777 1.716 Lower Range, D 0 0 0 0 0 0.076 0.136 0.184 0.223 0.284 covo

Step by Step Solution

There are 3 Steps involved in it

1 Expert Approved Answer
Step: 1 Unlock blur-text-image
Question Has Been Solved by an Expert!

Get step-by-step solutions from verified subject matter experts

Step: 2 Unlock
Step: 3 Unlock

Students Have Also Explored These Related General Management Questions!