

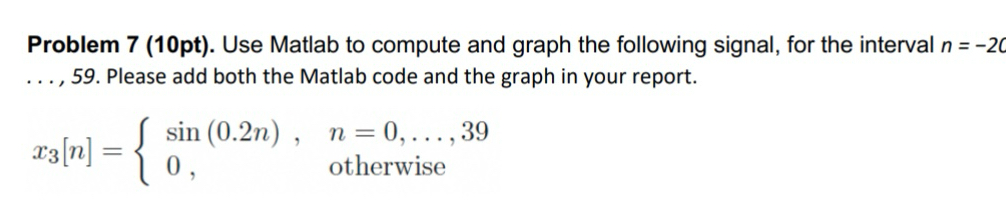
Question: Problem 7 ( 1 0 pt ) . Use Matlab to compute and graph the following signal, for the interval n = - 2 0
Problem pt Use Matlab to compute and graph the following signal, for the interval Please add both the Matlab code and the graph in your report.
Step by Step Solution
There are 3 Steps involved in it
1 Expert Approved Answer
Step: 1 Unlock

Question Has Been Solved by an Expert!
Get step-by-step solutions from verified subject matter experts
Step: 2 Unlock
Step: 3 Unlock