

Question: Problem 7: For the data in Ball Weight sheet, conduct Capability Analysis if the USL and LSL are 25 and 23 respectively. What results do
Problem 7:
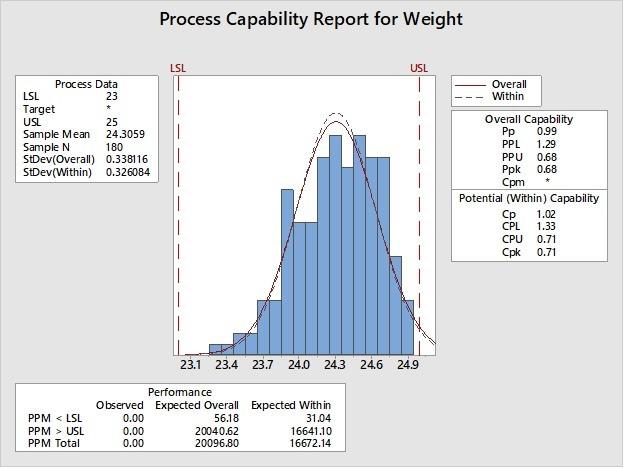
For the data in Ball Weight sheet, conduct Capability Analysis if the USL and LSL are 25 and 23 respectively. What results do you draw from your analysis?
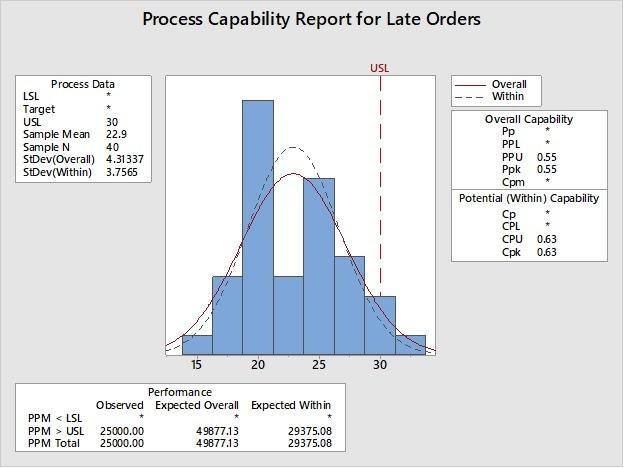
For the data in Late Orders sheet, conduct Capability Analysis if the maximum allowed late orders are 30. What results do you draw from your analysis?
Critically analysis and explain each graph in each question
Process Capability Report for Weight LSL USL Process Data LSL 23 Target USL 25 Sample Mean 24.3059 Sample N 180 StDev(Overall) 0.338116 StDev(Within) 0.326084 Overall Within Overall Capability Pp 0.99 PPL 1.29 PPU 0.68 Ppk 0.68 Cpm Potential (Within) Capability 1.02 CPL 1.33 CPU 0.71 Cpk 0.71 23.1 23.4 23.7 24.0 24.3 24.6 249 PPMStep by Step Solution
There are 3 Steps involved in it
1 Expert Approved Answer
Step: 1 Unlock

Question Has Been Solved by an Expert!
Get step-by-step solutions from verified subject matter experts
Step: 2 Unlock
Step: 3 Unlock