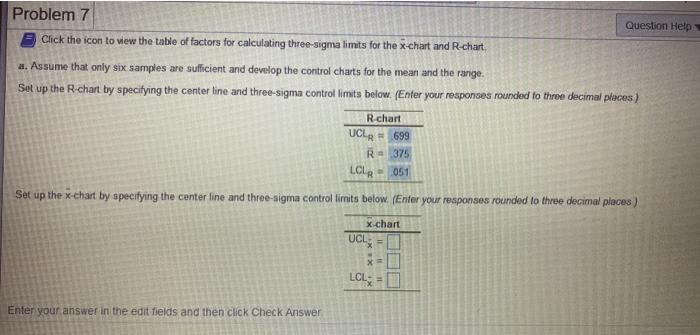
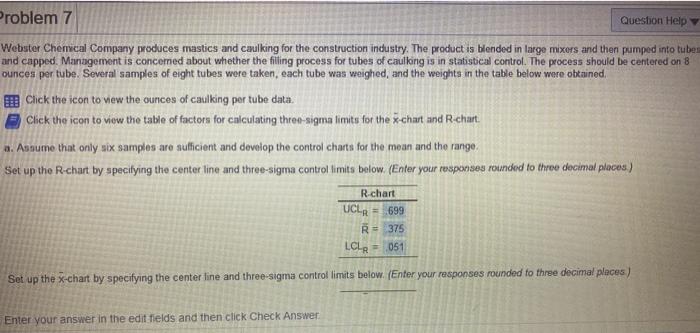
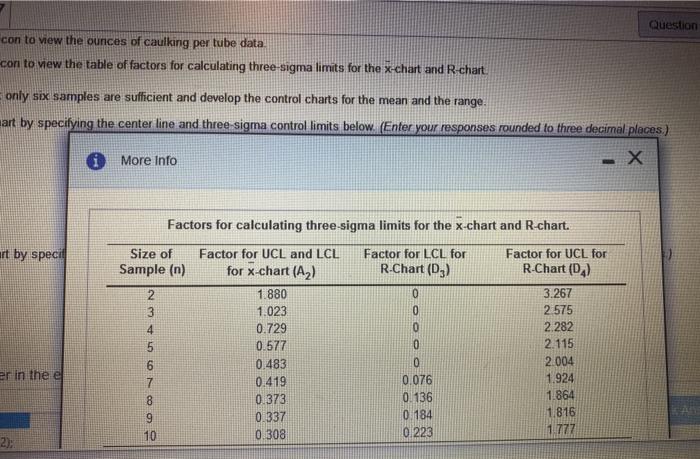
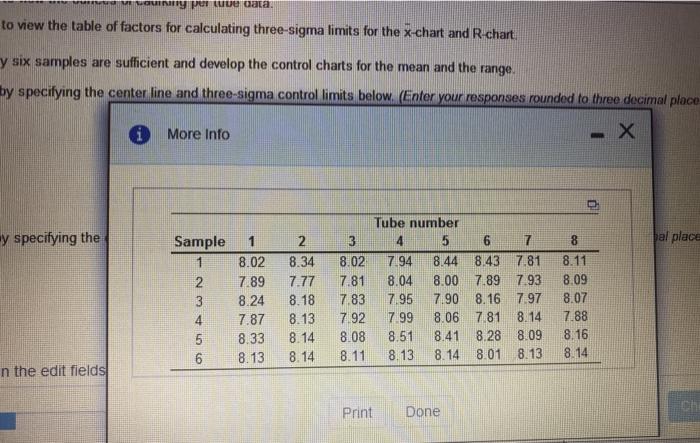
Question: Problem 7 Question Help Click the icon to view the table of factors for calculating three-sigma limits for the x-chart and R-chart a. Assume that

Problem 7 Question Help Click the icon to view
Problem 7 Question Help Click the icon to view the table of factors for calculating three-sigma limits for the x-chart and R-chart a. Assume that only six samples are sufficient and develop the control charts for the mean and the range. Set up the R-chart by specifying the center line and three-sigma control limits below. (Enter your responses rounded to three decimal places) R.chart UCLR = 699 R$ 375 LCR-051 Set up the x-chart by specifying the center line and three-sigma control limits below. (Enter your responses rounded to three decimal places) x.chart UCLE XXX LOL; Enter your answer in the edit fields and then click Check Answer Problem 7 Question Help Webster Chemical Company produces mastics and caulking for the construction industry. The product is blended in large mixers and then pumped into tube and capped. Management is concerned about whether the filling process for tubes of caulling is in statistical control. The process should be centered on 8 ounces per tube. Several samples of eight tubes were taken, each tube was weighed, and the weights in the table below were obtained. Click the icon to view the ounces of caulking per tube data. Click the icon to view the table of factors for calculating three-sigma limits for the x-chart and R.chart. a. Assume that only six samples are sufficient and develop the control charts for the mean and the range, Set up the R-chart by specifying the center line and three-sigma control limits below. (Enter your responses rounded to three decimal places) R.chart UCLR = 699 R375 LCLR 051 Set up the x-chart by specifying the center line and three-sigma control limits below. (Enter your responses rounded to three decimal places) Enter your answer in the edit fields and then click Check Answer Question con to view the ounces of caulking per tube data con to view the table of factors for calculating three-sigma limits for the x-chart and R-chart. only six samples are sufficient and develop the control charts for the mean and the range art by specifying the center line and three sigma control limits below. (Enter your responses rounded to three decimal places.) More Info Factors for calculating three-sigma limits for the x-chart and R-chart. art by specil Size of Sample (n) Factor for LCL for R-Chart (D3) Factor for UCL and LCL for X-chart (A2) 1.880 1.023 0.729 0.577 0.483 0.419 0.373 0.337 0.308 0 0 0 0 4 5 6 7 8 9 10 Factor for UCL for R-Chart (D4) 3.267 2.575 2.282 2.115 2.004 1.924 1.864 1,816 1.777 er in the e 0 0.076 0.136 0.184 0.223 2); MIAMIMNOVI Put uue data. to view the table of factors for calculating three-sigma limits for the x-chart and R chart y six samples are sufficient and develop the control charts for the mean and the range, by specifying the center line and three-sigma control limits below. (Enter your responses rounded to three decimal place X 1 More Info y specifying the 8 bal place Sample 1 2 3 4 5 6 1 8.02 7.89 8.24 7.87 8.33 8.13 2 8.34 7.77 8.18 8.13 8.14 8.14 3 8.02 7.81 7 83 792 8.08 8.11 Tube number 4 5 6 7 7.94 8.44 8.43 7.81 8.04 8.00 7.89 7.93 7.95 7.90 8.16 797 7 99 8.06 7.81 8.14 8.51 8.41 8.28 8.09 8.13 8.14 8.01 8.13 8.11 8.09 8.07 7.88 8.16 8.14 n the edit fields Print Done

Step by Step Solution

There are 3 Steps involved in it

1 Expert Approved Answer
Step: 1 Unlock blur-text-image
Question Has Been Solved by an Expert!

Get step-by-step solutions from verified subject matter experts

Step: 2 Unlock
Step: 3 Unlock

Students Have Also Explored These Related General Management Questions!