

Question: Problem 7-07 Choose the correct security market line graph for each of the following conditions: a. (1) RFR = 0.07; RM(proxy) = 0.13 (2) R
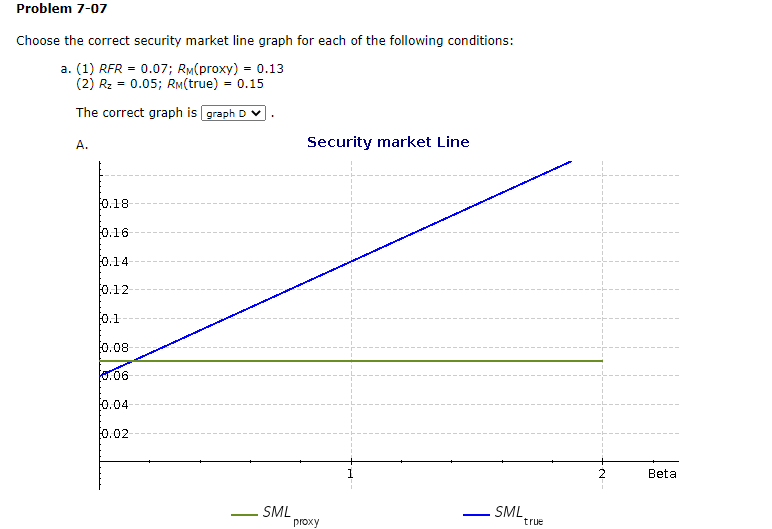
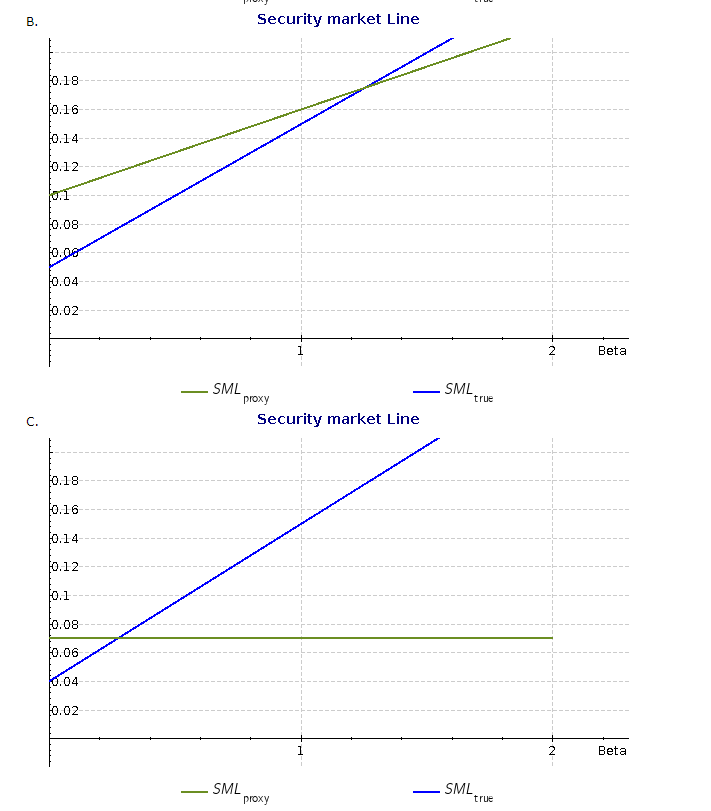
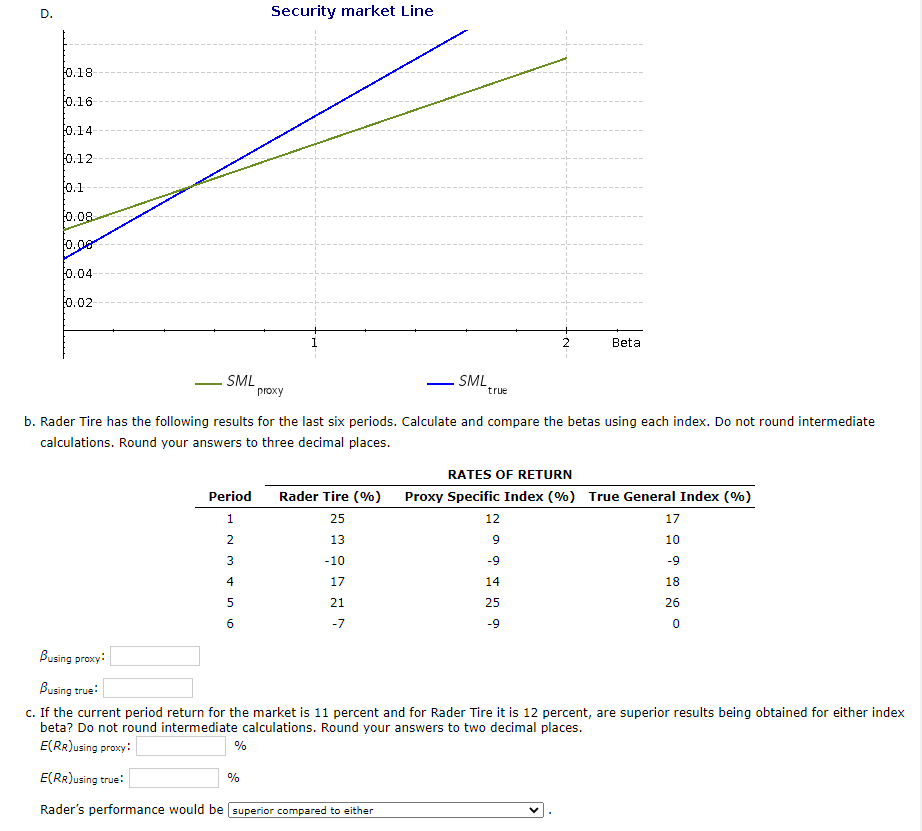
Problem 7-07 Choose the correct security market line graph for each of the following conditions: a. (1) RFR = 0.07; RM(proxy) = 0.13 (2) R = 0.05; RM(true) = 0.15 The correct graph is graph D A. 0.18 0.16 0.14 0.12 0.1 0.08 0.06 0.04 0.02 SML Security market Line proxy SML true N Beta B. 0.18 0.16 0.14 0.12 0.1 10.08 fo.08 0.04 0.02 0.18 0.16 0.14 0.12 0.1 0.08 0.06 0.04 0.02 SML SML Security market Line proxy Security market Line proxy SML true SML true 2 Beta Beta D. 0.18 0.16 0.14 0.12 0.1 0.08 0.00 10.04 0.02 SML Period 1 NM & in 2 3 4 b. Rader Tire has the following results for the last six periods. Calculate and compare the betas using each index. Do not round intermediate calculations. Round your answers to three decimal places. 5 6 Security market Line % proxy % SML Rader Tire (%) 25 13 -10 17 21 -7 true 2 12 9 Beta RATES OF RETURN Proxy Specific Index (%) True General Index (%) -9 14 25 -9 Busing proxy: Busing true: c. If the current period return for the market is 11 percent and for Rader Tire it is 12 percent, are superior results being obtained for either index beta? Do not round intermediate calculations. Round your answers to two decimal places. E(RR) using proxy: E(RR) using true: Rader's performance would be superior compared to either 17 10 -9 18 26 0
Step by Step Solution
There are 3 Steps involved in it

Get step-by-step solutions from verified subject matter experts