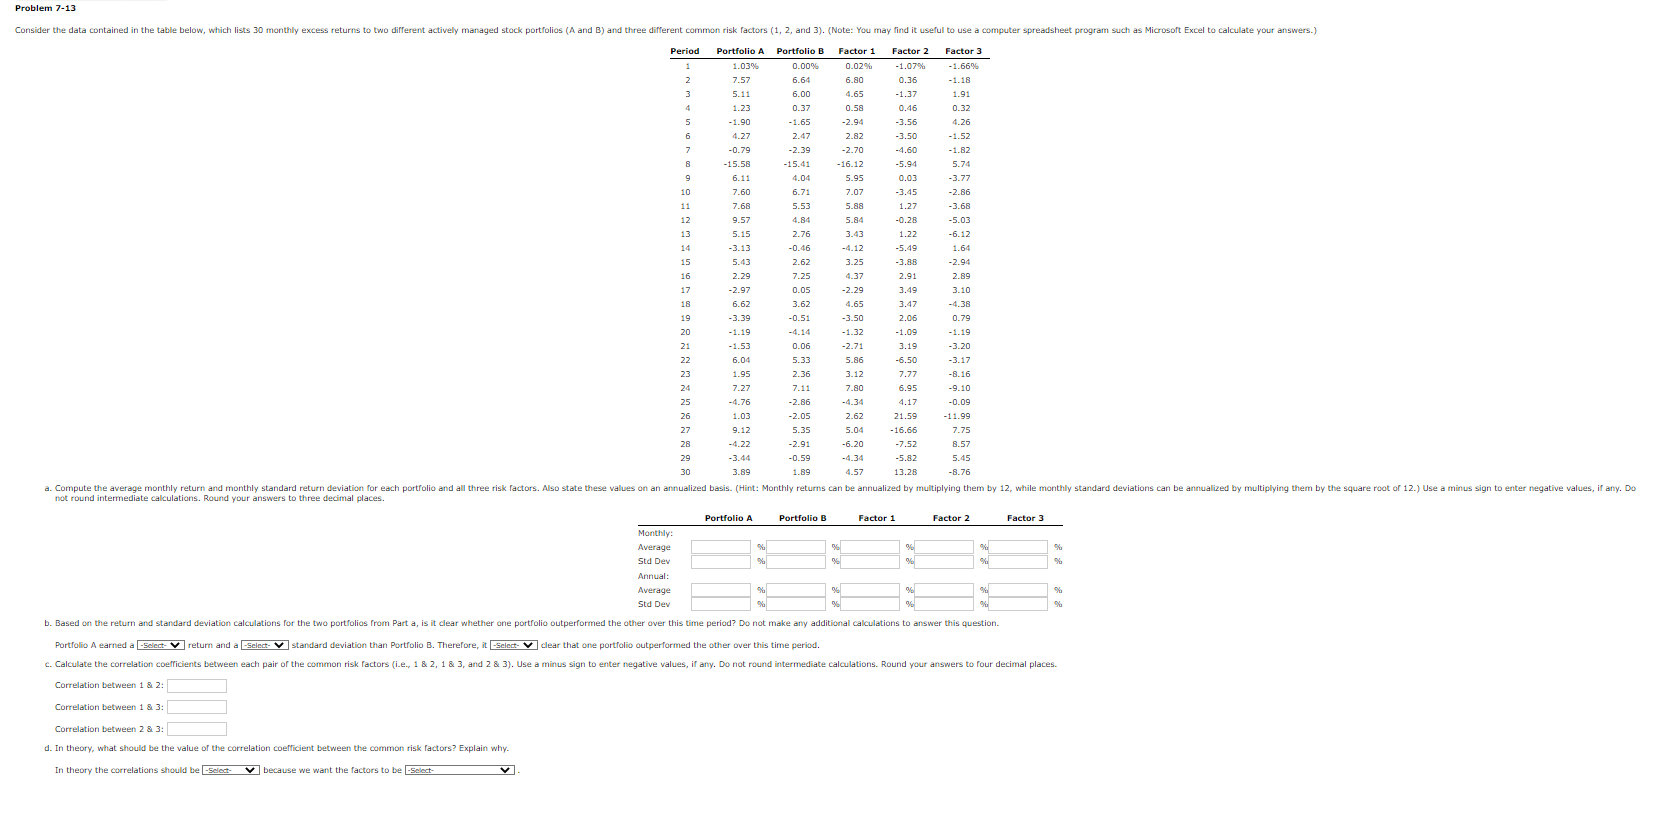
Question: Problem 7-13 Consider the data contained in the table below, which lists 30 monthly excess returns to two different actively managed stock portfolios (A and

Problem 7-13 Consider the data contained in the
Problem 7-13 Consider the data contained in the table below, which lists 30 monthly excess returns to two different actively managed stock portfolios (A and B) and three different common risk factors (1, 2, and 3). (Note: You may find it useful to use a computer spreadsheet program such as Microsoft Excel to calculate your answers.) Period Portfolio A Portfolio B Factor 1 Factor 2 Factor 3 1.03% 0.00% 0.02% -1.07 -1.66% 7.57 5.64 5.80 0.36 -1.18 5.11 5.00 4.65 -1.37 1.91 1.23 0.37 0.58 0.46 0.32 -1.90 -1.65 2.94 -3.56 4.26 4.27 247 2.82 3.50 1.52 -0.79 -2.39 2.70 -4.60 -1.82 -15.58 15.4 16.12 5.94 5.74 6.11 4.04 5.95 0.03 -3.77 10 7.60 5.71 7.07 3.45 -2.86 11 7.68 5.53 5.88 1.27 3.68 12 9.57 4.84 5.84 -0.28 -5.03 13 5.15 2.76 3.43 1.22 6.12 14 3.13 0.46 4.12 -5.49 1.64 15 5.4 2.62 3.25 3.8B 2.94 16 2.29 7.25 4.37 2.91 2.89 17 -2.9 0.05 2.29 3.49 3.10 18 6.6 3.62 1.65 3.47 -4.38 19 -3.3 0.51 3.50 2.06 0.79 1.19 4.14 1.32 -1.09 -1.19 -1.53 0.06 -2.7: 3.19 -3.20 6.04 .33 5.86 5.50 3.17 23 1.95 2.36 3.12 7.77 -8.16 24 7.27 7.11 7.80 5.95 -9.10 25 -4.76 2.86 4.34 1.17 0.09 26 1.03 2.05 2.62 21.5 11.99 27 9.12 5.35 5.04 16.66 7.75 28 -4.22 2.91 .6.20 -7.52 8.57 29 -3.44 0.59 4.34 5.82 5.45 30 3.89 1.89 4.5 13.28 8.76 a. Compute the average monthly return and monthly standard return deviation for each portfolio and all three risk factors. Also state these values on an annualized basis. (Hint: Monthly returns can be annualized by multiplying them by 12, while monthly standard deviations can be annualized by multiplying them by the square root of 12.) Use a minus sign to enter negative values, if any. Do not round intermediate calculations. Round your answers to three decimal places. Portfolio A Portfolio B Factor 1 Factor 2 Factor 3 Monthly: Average 96 2 Std Dev Annual: Average Std Dev b. Based on the return and standard deviation calculations for the two portfolios from Part a, is it clear whether one portfolio outperformed the other over this time period? Do not make any additional calculations to answer this question. Portfolio A earned a [-Select- V return and a [select- V standard deviation than Portfolio B. Therefore, it [select- V clear that one portfolio outperformed the other over this time period. c. Calculate the correlation coefficients between each pair of the common risk factors (i.e., 1 & 2, 1 & 3, and 2 & 3). Use a minus sign to enter negative values, if any. Do not round intermediate calculations. Round your answers to four decimal places. Correlation between 1 & 2: Correlation between 1 & 3: Correlation between 2 & 3: d. In theory, what should be the value of the correlation coefficient between the common risk factors? Explain why. In theory the correlations should be [-Select because we want the factors to be [-Select

Step by Step Solution

There are 3 Steps involved in it

1 Expert Approved Answer
Step: 1 Unlock blur-text-image
Question Has Been Solved by an Expert!

Get step-by-step solutions from verified subject matter experts

Step: 2 Unlock
Step: 3 Unlock

Students Have Also Explored These Related Finance Questions!