

Question: Problem 8. (2pts) The three graphs below are approximate sampling distributions for sample means from a population with p = 5. All three graphs were
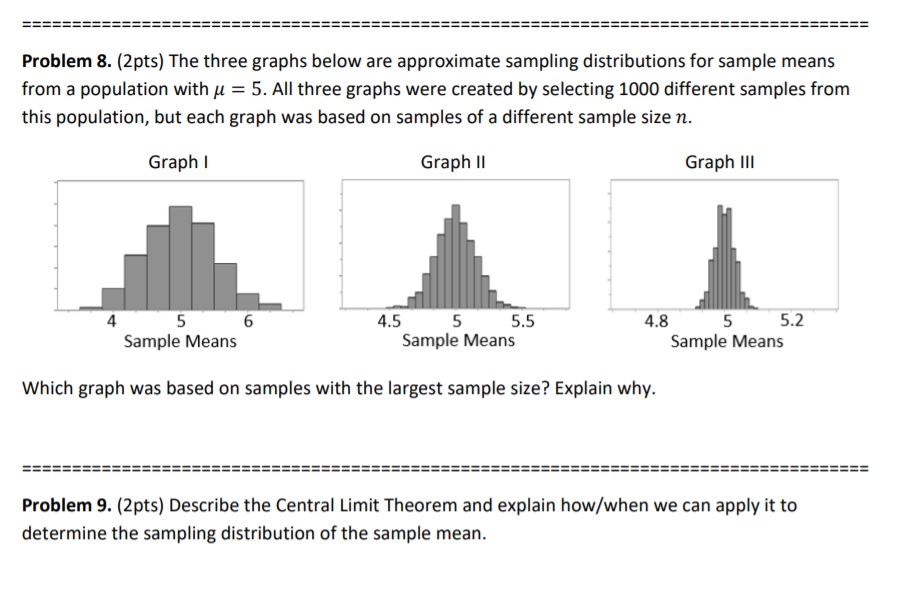
Problem 8. (2pts) The three graphs below are approximate sampling distributions for sample means from a population with p = 5. All three graphs were created by selecting 1000 different samples from this population, but each graph was based on samples of a different sample size :1. Graph | Graph II Graph III 4 5 6 4.5 5 5.5 ' '4La' 5 52' Sample Means Sample Means Sample Means Which graph was based on samples with the largest sample size? Explain why. Problem 9. (Zpts) Describe the Central Limit Theorem and explain how/when we can apply it to determine the sampling distribution of the sample mean
Step by Step Solution
There are 3 Steps involved in it
1 Expert Approved Answer
Step: 1 Unlock

Question Has Been Solved by an Expert!
Get step-by-step solutions from verified subject matter experts
Step: 2 Unlock
Step: 3 Unlock