

Question: Problem # 8. In a small summer course, Professor Blinky wants to compare the number of homeworks completed to final grades as shown in the


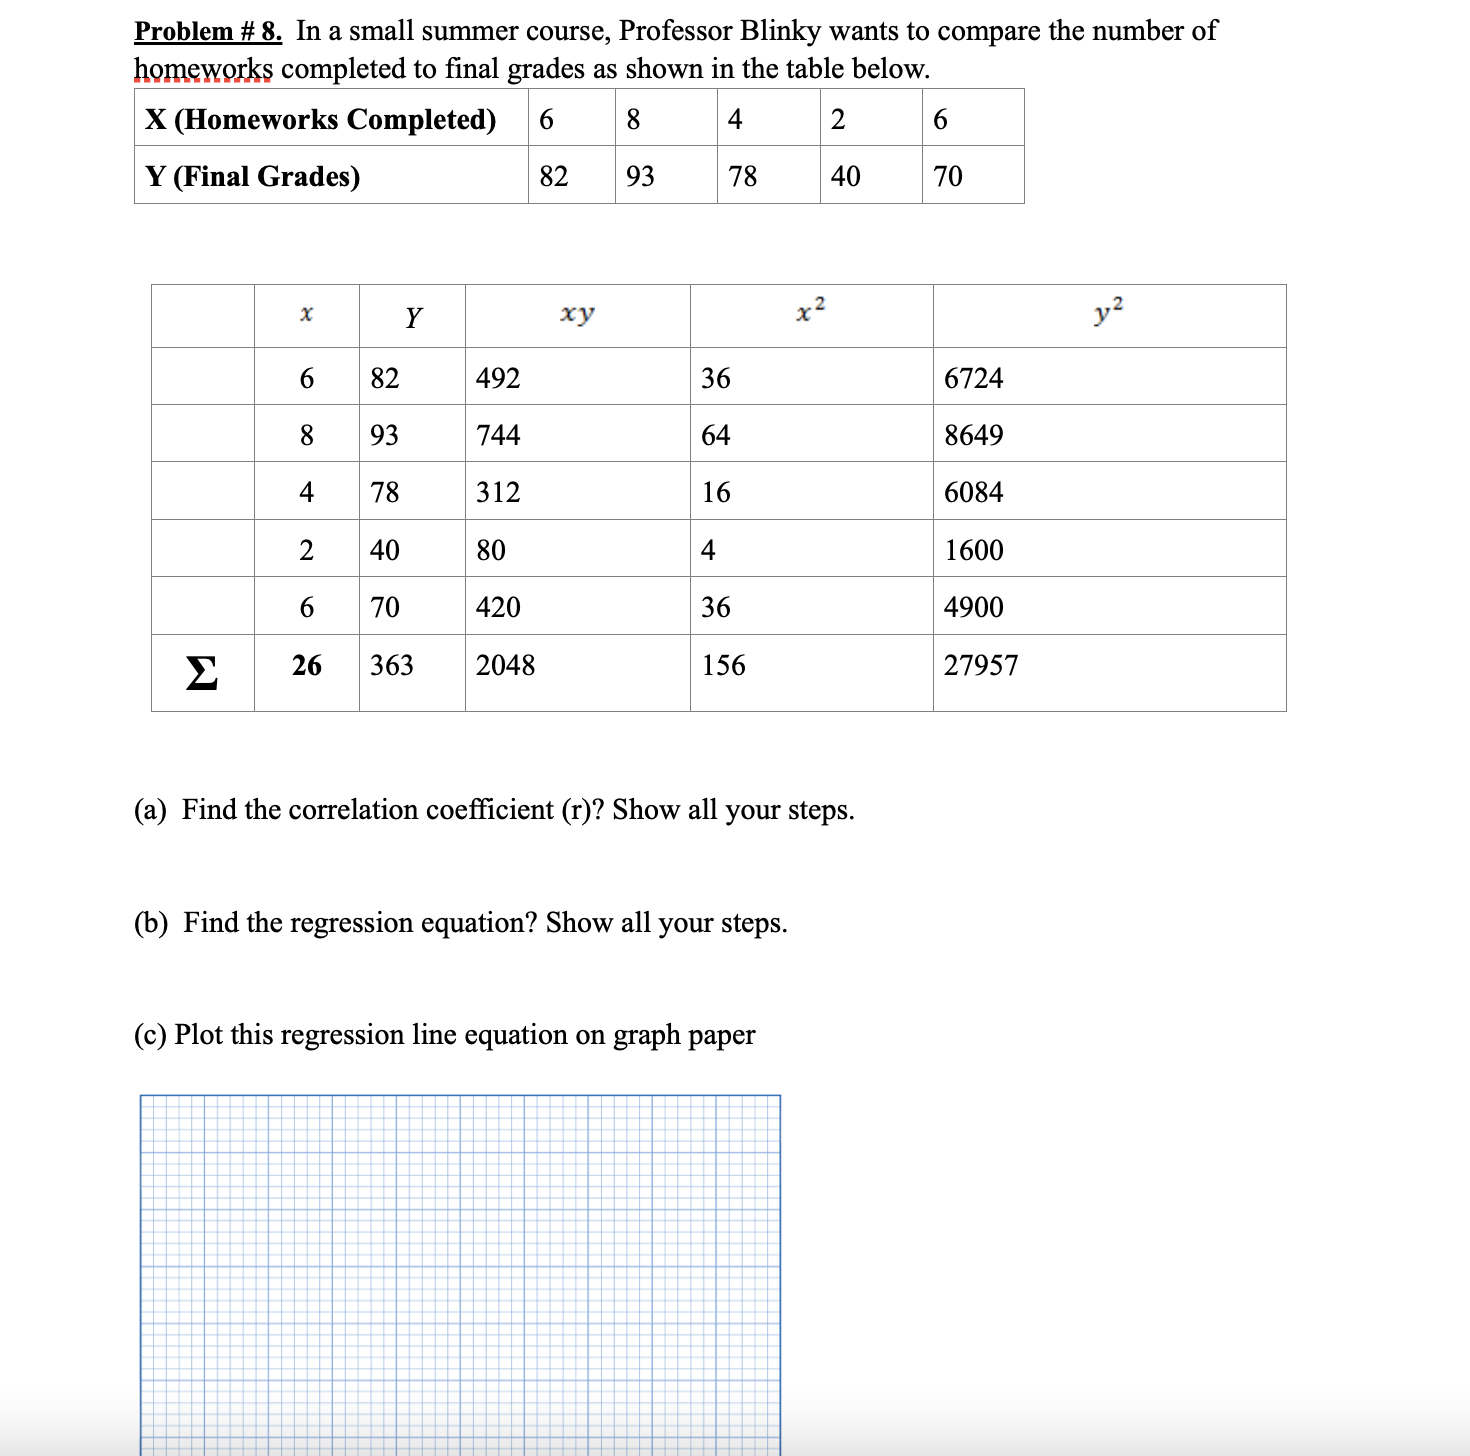
Problem # 8. In a small summer course, Professor Blinky wants to compare the number of homeworks completed to final grades as shown in the table below. X (Homeworks Completed) 6 8 4 2 6 Y (Final Grades) 82 93 78 40 70 X Y xy x2 6 82 492 36 6724 8 93 744 64 8649 4 78 312 16 6084 N 40 80 4 1600 6 70 420 36 4900 26 363 2048 156 27957 (a) Find the correlation coefficient (r)? Show all your steps. (b) Find the regression equation? Show all your steps. (c) Plot this regression line equation on graph paperProblem # 7. The president of a large university wishes to estimate the average age of the students presently enrolled. From past studies, the standard deviation of the population is known to be 2 years. A sample of 50 students is selected, and the mean is found to 23.2 years. Find the 95% condence interval of the population mean? Show all your steps
Step by Step Solution
There are 3 Steps involved in it

Get step-by-step solutions from verified subject matter experts