

Question: Problem 8-40 (Algorithmic) (LO. 2, 3, 9) On May 5, 2019, Javier Sanchez purchased and placed in service a new 7-year class asset costing $386,000
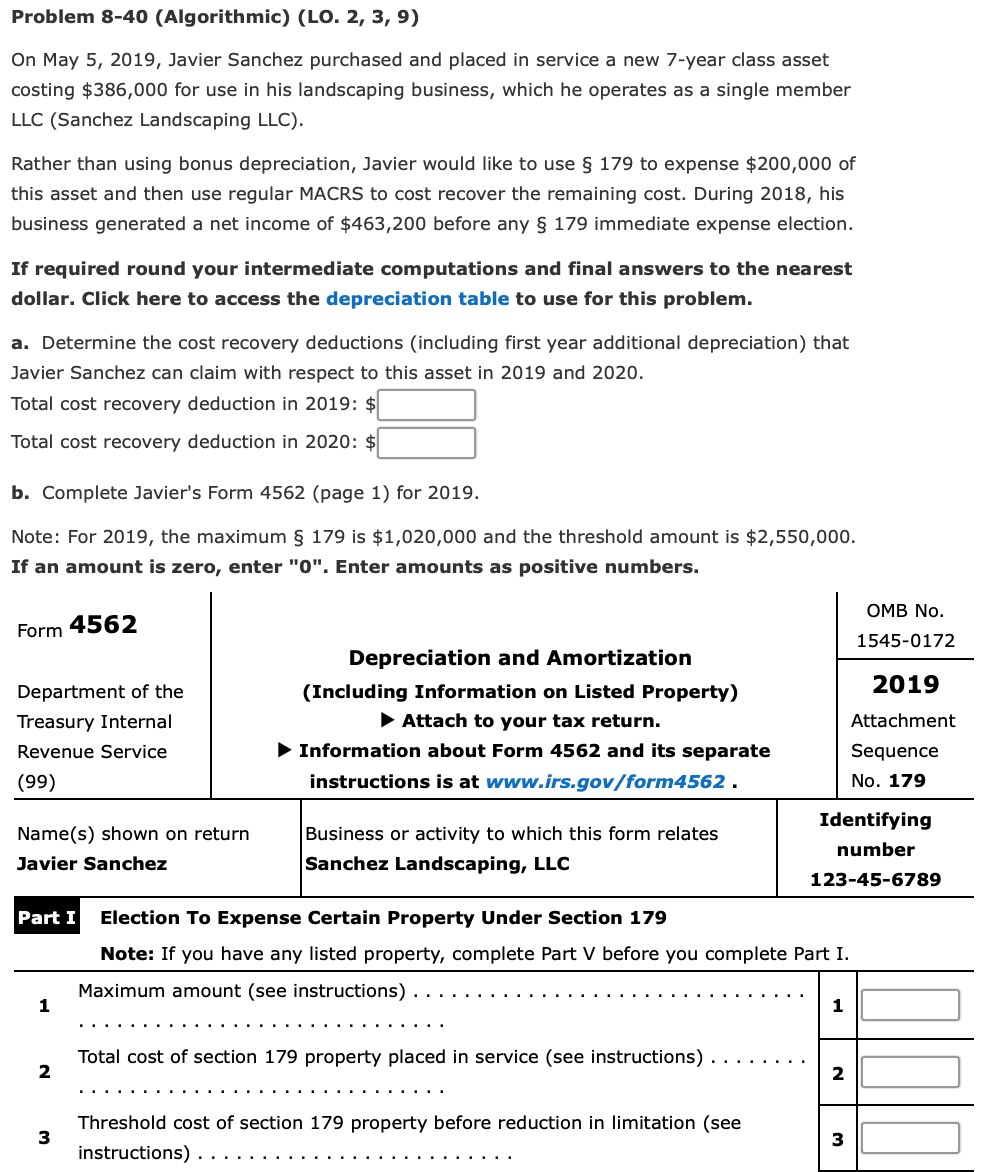
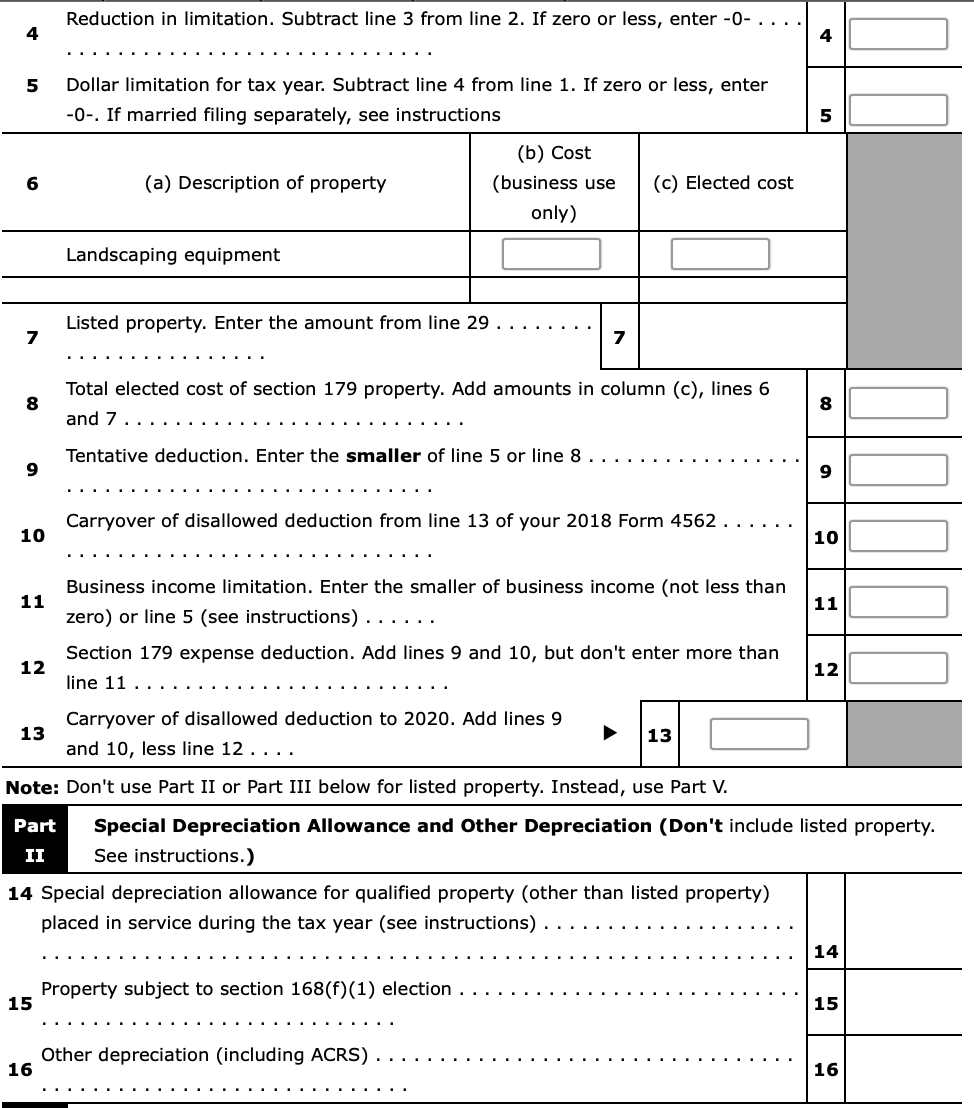
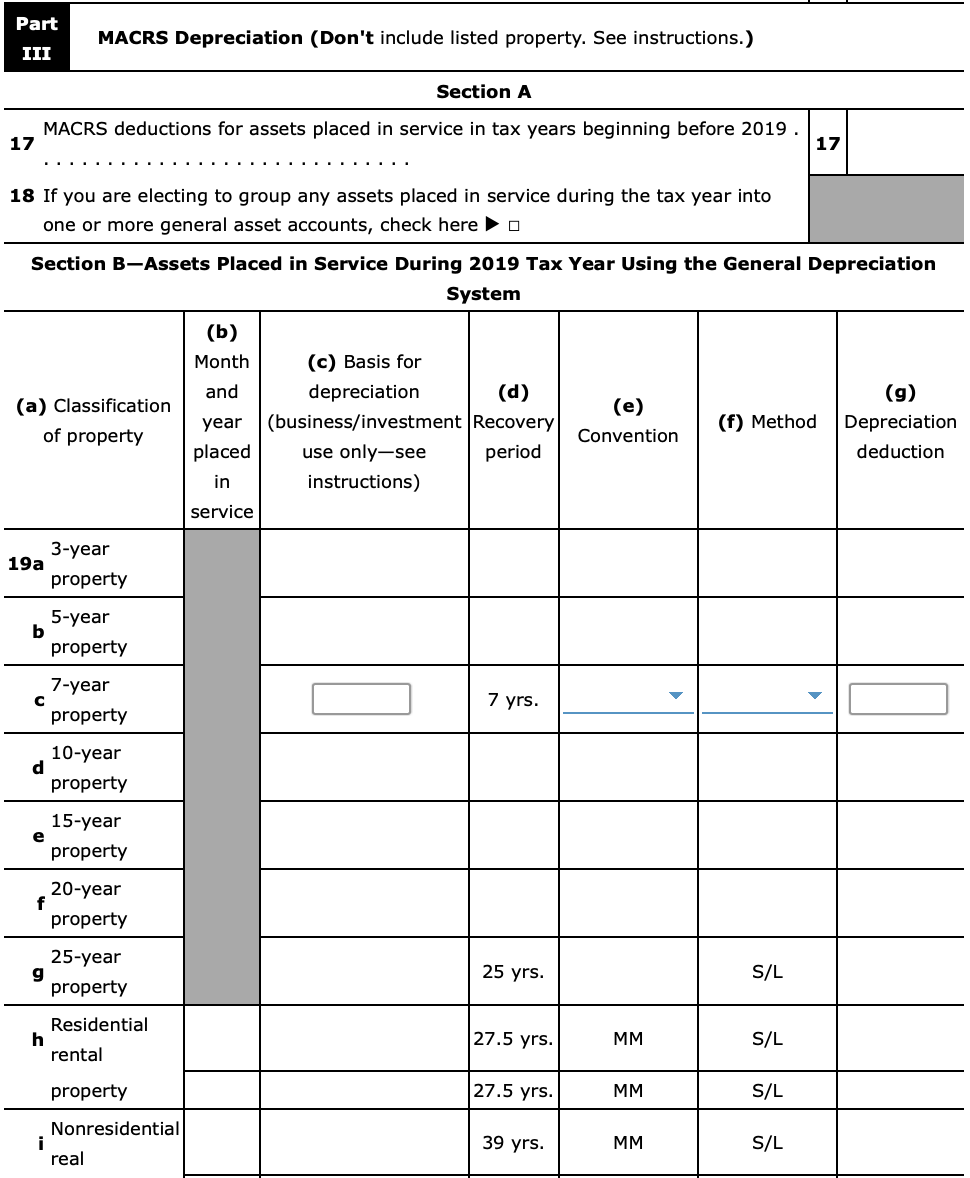
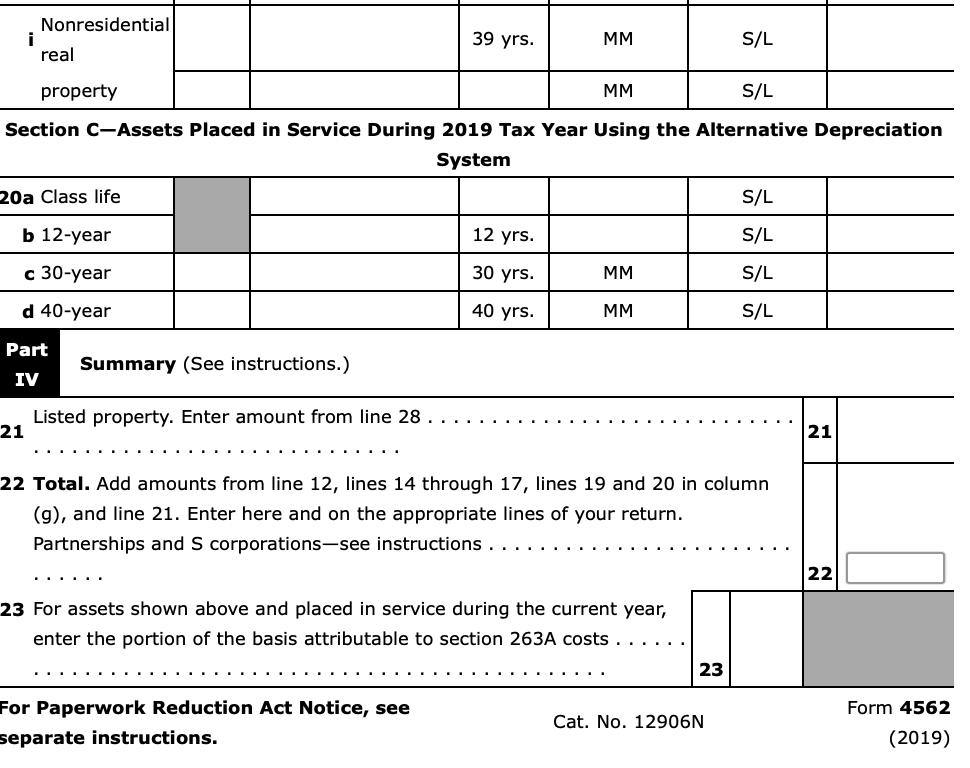
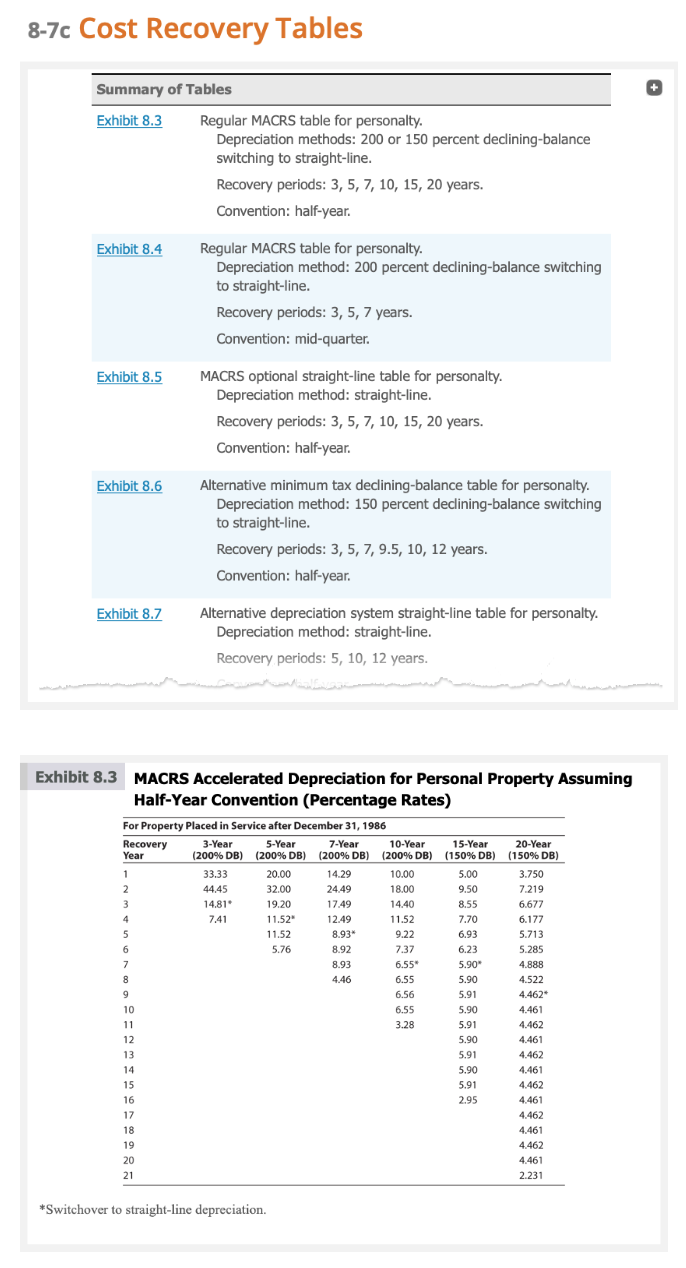
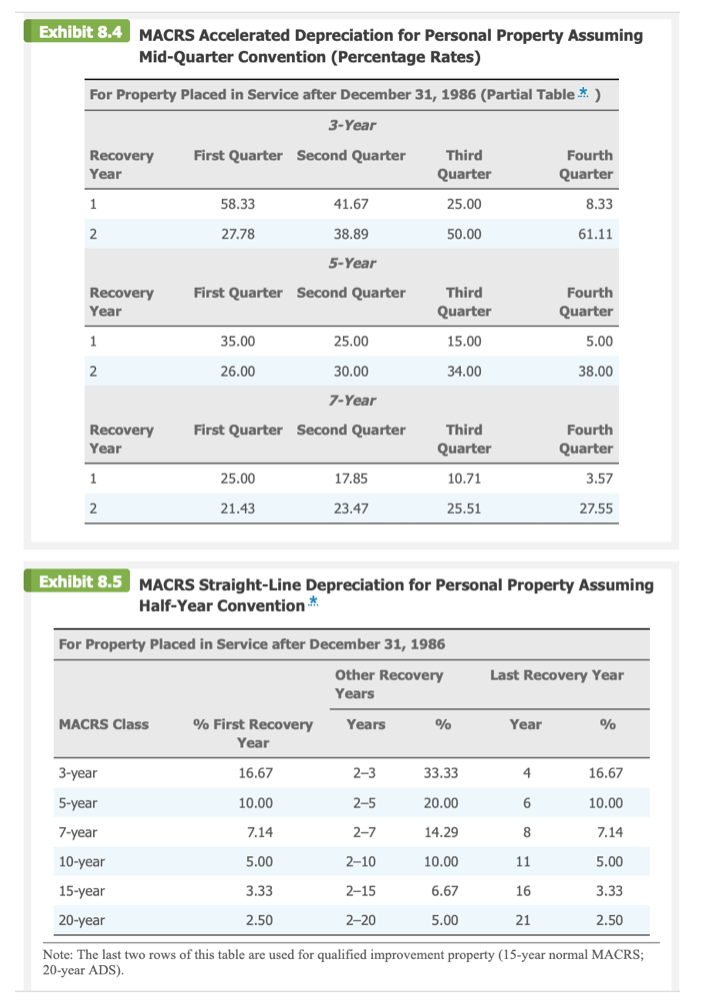
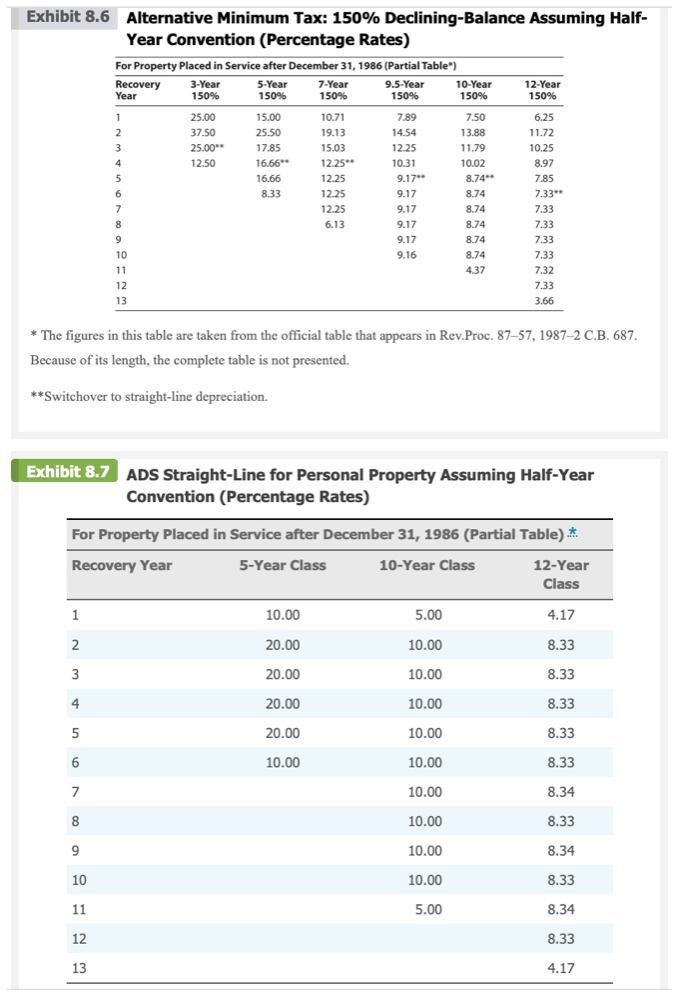
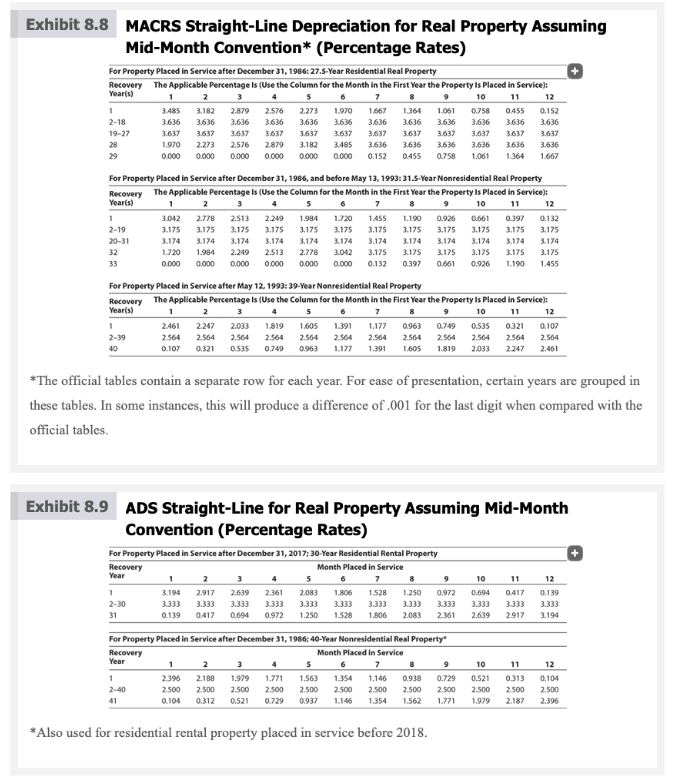
Problem 8-40 (Algorithmic) (LO. 2, 3, 9) On May 5, 2019, Javier Sanchez purchased and placed in service a new 7-year class asset costing $386,000 for use in his landscaping business, which he operates as a single member LLC (Sanchez Landscaping LLC). Rather than using bonus depreciation, Javier would like to use 179 to expense $200,000 of this asset and then use regular MACRS to cost recover the remaining cost. During 2018, his business generated a net income of $463,200 before any 179 immediate expense election. If required round your intermediate computations and final answers to the nearest dollar. Click here to access the depreciation table to use for this problem. a. Determine the cost recovery deductions (including first year additional depreciation) that Javier Sanchez can claim with respect to this asset in 2019 and 2020. Total cost recovery deduction in 2019: $ Total cost recovery deduction in 2020: $ b. Complete Javier's Form 4562 (page 1) for 2019. Note: For 2019, the maximum 179 is $1,020,000 and the threshold amount is $2,550,000. If an amount is zero, enter "0". Enter amounts as positive numbers. OMB No. Form 4562 1545-0172 2019 Department of the Treasury Internal Revenue Service (99) Depreciation and Amortization (Including Information on Listed Property) Attach to your tax return. Information about Form 4562 and its separate instructions is at www.irs.gov/form4562. Attachment Sequence No. 179 Name(s) shown on return Javier Sanchez Business or activity to which this form relates Sanchez Landscaping, LLC Identifying number 123-45-6789 Part I Election To Expense Certain Property Under Section 179 Note: If you have any listed property, complete Part V before you complete Part I. Maximum amount (see instructions) 1 1 Total cost of section 179 property placed in service (see instructions) 2 2 3 Threshold cost of section 179 property before reduction in limitation (see instructions) 3 Reduction in limitation. Subtract line 3 from line 2. If zero or less, enter -0- 4 5 5 Dollar limitation for tax year. Subtract line 4 from line 1. If zero or less, enter -0-. If married filing separately, see instructions (b) Cost (a) Description of property (business use (C) Elected cost only) 6 Landscaping equipment Listed property. Enter the amount from line 29 7 7 8 Total elected cost of section 179 property. Add amounts in column (c), lines 6 and 7. 8 Tentative deduction. Enter the smaller of line 5 or line 8 9 9 Carryover of disallowed deduction from line 13 of your 2018 Form 4562 .... 10 10 11 11 Business income limitation. Enter the smaller of business income (not less than zero) or line 5 (see instructions) Section 179 expense deduction. Add lines 9 and 10, but don't enter more than line 11... 12 12 Carryover of disallowed deduction to 2020. Add lines 9 13 13 and 10, less line 12 .... Note: Don't use Part II or Part III below for listed property. Instead, use Part V. Part Special Depreciation Allowance and Other Depreciation (Don't include listed property. II See instructions.) 14 Special depreciation allowance for qualified property (other than listed property) placed in service during the tax year (see instructions). 14 Property subject to section 168(f)(1) election 15 15 Other depreciation (including ACRS) 16 16 Part MACRS Depreciation (Don't include listed property. See instructions.) III Section A MACRS deductions for assets placed in service in tax years beginning before 2019. 17 17 18 If you are electing to group any assets placed in service during the tax year into one or more general asset accounts, check here Section B-Assets Placed in Service During 2019 Tax Year Using the General Depreciation System (b) Month and (g) (a) Classification of property (c) Basis for depreciation (d) (business/investment Recovery use only-see period instructions) year placed (f) Method (e) Convention Depreciation deduction in service 3-year 19a property 5-year b property 7-year property 7 yrs. 10-year d property e 15-year property 20-year f property 25 yrs. S/L 25-year g property Residential h rental 27.5 yrs. MM S/L property 27.5 yrs. MM S/L i Nonresidential real 39 yrs. MM S/L i Nonresidential real 39 yrs. MM S/L property MM S/L Section C-Assets Placed in Service During 2019 Tax Year Using the Alternative Depreciation System 20a Class life S/L b 12-year 12 yrs. S/L c 30-year 30 yrs. MM S/L d 40-year 40 yrs. MM S/L Part Summary (See instructions.) IV Listed property. Enter amount from line 28 21 21 22 Total. Add amounts from line 12, lines 14 through 17, lines 19 and 20 in column (g), and line 21. Enter here and on the appropriate lines of your return. Partnerships and S corporations-see instructions. 22 23 For assets shown above and placed in service during the current year, enter the portion of the basis attributable to section 263A costs 23 For Paperwork Reduction Act Notice, see separate instructions. Cat. No. 12906N Form 4562 (2019) 8-7c Cost Recovery Tables Summary of Tables Exhibit 8.3 Regular MACRS table for personalty. Depreciation methods: 200 or 150 percent declining-balance switching to straight-line. Recovery periods: 3, 5, 7, 10, 15, 20 years. Convention: half-year. Exhibit 8.4 Regular MACRS table for personalty. Depreciation method: 200 percent declining-balance switching to straight-line. Recovery periods: 3, 5, 7 years. Convention: mid-quarter. Exhibit 8.5 MACRS optional straight-line table for personalty. Depreciation method: straight-line. Recovery periods: 3, 5, 7, 10, 15, 20 years. Convention: half-year. Exhibit 8.6 Alternative minimum tax declining-balance table for personalty. Depreciation method: 150 percent declining-balance switching to straight-line. Recovery periods: 3, 5, 7, 9.5, 10, 12 years. Convention: half-year. Exhibit 8.7 Alternative depreciation system straight-line table for personalty. Depreciation method: straight-line. Recovery periods: 5, 10, 12 years. Exhibit 8.3 MACRS Accelerated Depreciation for Personal Property Assuming Half-Year Convention (Percentage Rates) For Property Placed in Service after December 31, 1986 Recovery 3-Year 5-Year 7-Year 10-Year 15-Year 20-Year Year (200% DB) (200% DB) (200% DB) (200% DB) (200% DB) (150% DB) ((150% DB) 1 33.33 20.00 14.29 10.00 5.00 3.750 2 44.45 32.00 24.49 18.00 9.50 7.219 3 14.81 19.20 17.49 14.40 8.55 6.677 4 7.41 11.52 12.49 11.52 7.70 6.177 5 11.52 8.93 9.22 6.93 5.713 6 5.76 8.92 7.37 6.23 5.285 7 8.93 6.55 5.90" 4.888 8 4.46 6.55 5.90 4.522 9 6.56 5.91 4.462* 10 6.55 5.90 4.461 11 3.28 5.91 4.462 12 5.90 4.461 13 5.91 4.462 14 5.90 4.461 15 5.91 4.462 16 2.95 4.461 17 4.462 18 4.461 19 4.462 20 4.461 21 2.231 *Switchover to straight-line depreciation. Exhibit 8.4 MACRS Accelerated Depreciation for Personal Property Assuming Mid-Quarter Convention (Percentage Rates) For Property Placed in Service after December 31, 1986 (Partial Table* ) 3-Year Recovery Year First Quarter Second Quarter Third Quarter Fourth Quarter 1 58.33 41.67 25.00 8.33 2. 27.78 38.89 50.00 61.11 5-Year First Quarter Second Quarter Recovery Year Third Quarter Fourth Quarter 1 35.00 25.00 15.00 5.00 2 26.00 30.00 34.00 38.00 7-Year Recovery Year First Quarter Second Quarter Third Quarter Fourth Quarter 1 25.00 17.85 10.71 3.57 2 21.43 23.47 25.51 27.55 Exhibit 8.5 MACRS Straight-Line Depreciation for Personal Property Assuming Half-Year Convention For Property Placed in Service after December 31, 1986 Other Recovery Years Last Recovery Year MACRS Class Years % % First Recovery Year Year % 3-year 16.67 2-3 33.33 4 16.67 10.00 2-5 20.00 6 10.00 5-year 7-year 7.14 2-7 14.29 8 7.14 10-year 5.00 2-10 10.00 11 5.00 3.33 2-15 6.67 16 3.33 15-year 20-year 2.50 2-20 5.00 21 2.50 Note: The last two rows of this table are used for qualified improvement property (15-year normal MACRS; 20-year ADS). 150% Exhibit 8.6 Alternative Minimum Tax: 150% Declining-Balance Assuming Half- Year Convention (Percentage Rates) For Property Placed in Service after December 31, 1986 (Partial Table") Recovery 3-Year 5-Year 7-Year 9.5-Year 10-Year 12-Year Year 150% 150% 150% 150% 150% 1 25.00 15.00 10.71 7.89 7.50 6.25 2 37.50 25.50 19.13 14.54 13.88 11.72 3 25.00 17.85 15.03 12.25 11.79 10.25 4 12.50 12.25 10.31 10.02 8.97 5 12.25 9.17" 8.74" 7.85 6 8.33 12.25 9.17 8.74 7.33** 7 12.25 9.17 8.74 7.33 8 6.13 9.17 8.74 7.33 9 9.17 8.74 7.33 10 9.16 8.74 7.33 11 437 7.32 12 7.33 13 3.66 16.66 * 16.66 * The figures in this table are taken from the official table that appears in Rev.Proc. 87-57, 1987-2 C.B. 687. Because of its length, the complete table is not presented. **Switchover to straight-line depreciation. Exhibit 8.7 ADS Straight-Line for Personal Property Assuming Half-Year Convention (Percentage Rates) For Property Placed in Service after December 31, 1986 (Partial Table) * Recovery Year 5-Year Class 10-Year Class 12-Year Class 1 10.00 5.00 4.17 2 20.00 10.00 8.33 3 20.00 10.00 8.33 4 10.00 8.33 5 20.00 20.00 10.00 10.00 8.33 6 10.00 8.33 7 10.00 8.34 8 10.00 8.33 9 10.00 8.34 10 10.00 8.33 11 5.00 8.34 12 8.33 13 4.17 Exhibit 8.8 MACRS Straight-Line Depreciation for Real Property Assuming Mid-Month Convention* (Percentage Rates) For Property Placed in Service after December 31, 1986: 27.5-Year Residential Real Property + Recovery The Applicable Percentage Is (Use the Column for the Month in the First Year the Property is placed in Service): Year(s) 1 2 3 5 9 10 12 1 3.485 3.1822.879 2.576 2.273 1.970 1.667 1.364 1,061 0.758 0455 0.152 2-18 3.636 3.636 3.636 3.636 3.636 3.636 3.636 3.636 3,636 3.636 3.636 3.636 19-27 3.637 3.637 3.637 3637 3.637 3.637 3.637 3.637 3.637 3.637 3637 3.637 28 1.970 2.273 2.576 2879 3.182 3.485 3.636 3.636 3.636 3.636 3.636 3.636 29 0.000 0.000 0.000 0.000 0.000 0.152 0.455 0.758 1,061 1.364 1.667 For Property Placed in Service after December 31, 1986, and before May 13, 1993: 31.S-Year Nonresidential Real Property Recovery The Applicable Percentage Is (Use the Column for the Month in the First Year the Property is placed in Service): Year(s) 1 2 5 6 9 10 11 12 1 3.042 2.778 2.513 2.249 1.984 1.720 1455 1.190 0.926 0.661 0.397 0.132 2-19 3.175 3.175 3.175 3.175 3.175 3.175 3.175 3.175 3.175 3.175 3.175 3.175 20-31 3.174 3.174 3.174 3.174 3.174 3.174 3.174 3.174 3.174 3.174 3.174 3.174 32 1.720 1.984 2.249 2.513 2.778 3.042 3.175 3.175 3.175 3.175 3.175 3.175 33 0.000 0.000 0.000 0.000 0.000 0.000 0.132 0.397 0.661 0.926 1.190 1.455 For Property Placed in Service after May 12, 1993: 39-Year Nonresidential Real Property Recovery The Applicable Percentage Is (Use the Column for the Month in the First Year the Property is placed in Service): Yearts) 3 5 7 10 12 1 2.461 2.247 2.033 1.819 1.605 1.391 1.177 0.963 0.749 0.535 0321 0.107 2-39 2564 2.564 2.564 2.564 2.564 2.564 2.564 2.564 2.564 2.564 2.564 2.564 40 0.107 0.321 0.535 0.749 0.963 1.177 1.391 1.605 1.819 2.033 2.247 2461 *The official tables contain a separate row for each year. For ease of presentation, certain years are grouped in these tables. In some instances, this will produce a difference of .001 for the last digit when compared with the official tables Exhibit 8.9 ADS Straight-Line for Real Property Assuming Mid-Month Convention (Percentage Rates) For Property Placed in Service after December 31, 2017; 30-Year Residential Rental Property Recovery Month Placed in Service Year 5 6 1 3.194 3.333 0.139 2 2.917 3.333 0.417 1 2-30 31 3 2.639 3.333 0.694 2083 1.806 2.361 3.333 0.972 7 1.528 3.333 1.806 1.250 3.333 2.083 0.972 3.333 2.361 10 0.694 3.333 2.639 11 0.417 3.333 2917 12 0.139 3.333 3.194 1.250 1.528 11 For Property Placed in Service after December 31, 1986; 40-Year Nonresidential Real Property Recovery Month Placed in Service Year 1 2 5 6 7 9 1 2.396 2.188 1.979 1.771 1.563 1.354 1.146 0.938 0.729 2-40 2.500 2.500 2.500 2.500 2.500 2.500 2.500 2.500 41 0.104 0.312 0.521 0.729 0.937 1.146 1.354 1.562 1.771 10 0.521 2.500 1.979 12 0.104 2.500 2.396 0313 2.500 2.187 2.500 *Also used for residential rental property placed in service before 2018. Problem 8-40 (Algorithmic) (LO. 2, 3, 9) On May 5, 2019, Javier Sanchez purchased and placed in service a new 7-year class asset costing $386,000 for use in his landscaping business, which he operates as a single member LLC (Sanchez Landscaping LLC). Rather than using bonus depreciation, Javier would like to use 179 to expense $200,000 of this asset and then use regular MACRS to cost recover the remaining cost. During 2018, his business generated a net income of $463,200 before any 179 immediate expense election. If required round your intermediate computations and final answers to the nearest dollar. Click here to access the depreciation table to use for this problem. a. Determine the cost recovery deductions (including first year additional depreciation) that Javier Sanchez can claim with respect to this asset in 2019 and 2020. Total cost recovery deduction in 2019: $ Total cost recovery deduction in 2020: $ b. Complete Javier's Form 4562 (page 1) for 2019. Note: For 2019, the maximum 179 is $1,020,000 and the threshold amount is $2,550,000. If an amount is zero, enter "0". Enter amounts as positive numbers. OMB No. Form 4562 1545-0172 2019 Department of the Treasury Internal Revenue Service (99) Depreciation and Amortization (Including Information on Listed Property) Attach to your tax return. Information about Form 4562 and its separate instructions is at www.irs.gov/form4562. Attachment Sequence No. 179 Name(s) shown on return Javier Sanchez Business or activity to which this form relates Sanchez Landscaping, LLC Identifying number 123-45-6789 Part I Election To Expense Certain Property Under Section 179 Note: If you have any listed property, complete Part V before you complete Part I. Maximum amount (see instructions) 1 1 Total cost of section 179 property placed in service (see instructions) 2 2 3 Threshold cost of section 179 property before reduction in limitation (see instructions) 3 Reduction in limitation. Subtract line 3 from line 2. If zero or less, enter -0- 4 5 5 Dollar limitation for tax year. Subtract line 4 from line 1. If zero or less, enter -0-. If married filing separately, see instructions (b) Cost (a) Description of property (business use (C) Elected cost only) 6 Landscaping equipment Listed property. Enter the amount from line 29 7 7 8 Total elected cost of section 179 property. Add amounts in column (c), lines 6 and 7. 8 Tentative deduction. Enter the smaller of line 5 or line 8 9 9 Carryover of disallowed deduction from line 13 of your 2018 Form 4562 .... 10 10 11 11 Business income limitation. Enter the smaller of business income (not less than zero) or line 5 (see instructions) Section 179 expense deduction. Add lines 9 and 10, but don't enter more than line 11... 12 12 Carryover of disallowed deduction to 2020. Add lines 9 13 13 and 10, less line 12 .... Note: Don't use Part II or Part III below for listed property. Instead, use Part V. Part Special Depreciation Allowance and Other Depreciation (Don't include listed property. II See instructions.) 14 Special depreciation allowance for qualified property (other than listed property) placed in service during the tax year (see instructions). 14 Property subject to section 168(f)(1) election 15 15 Other depreciation (including ACRS) 16 16 Part MACRS Depreciation (Don't include listed property. See instructions.) III Section A MACRS deductions for assets placed in service in tax years beginning before 2019. 17 17 18 If you are electing to group any assets placed in service during the tax year into one or more general asset accounts, check here Section B-Assets Placed in Service During 2019 Tax Year Using the General Depreciation System (b) Month and (g) (a) Classification of property (c) Basis for depreciation (d) (business/investment Recovery use only-see period instructions) year placed (f) Method (e) Convention Depreciation deduction in service 3-year 19a property 5-year b property 7-year property 7 yrs. 10-year d property e 15-year property 20-year f property 25 yrs. S/L 25-year g property Residential h rental 27.5 yrs. MM S/L property 27.5 yrs. MM S/L i Nonresidential real 39 yrs. MM S/L i Nonresidential real 39 yrs. MM S/L property MM S/L Section C-Assets Placed in Service During 2019 Tax Year Using the Alternative Depreciation System 20a Class life S/L b 12-year 12 yrs. S/L c 30-year 30 yrs. MM S/L d 40-year 40 yrs. MM S/L Part Summary (See instructions.) IV Listed property. Enter amount from line 28 21 21 22 Total. Add amounts from line 12, lines 14 through 17, lines 19 and 20 in column (g), and line 21. Enter here and on the appropriate lines of your return. Partnerships and S corporations-see instructions. 22 23 For assets shown above and placed in service during the current year, enter the portion of the basis attributable to section 263A costs 23 For Paperwork Reduction Act Notice, see separate instructions. Cat. No. 12906N Form 4562 (2019) 8-7c Cost Recovery Tables Summary of Tables Exhibit 8.3 Regular MACRS table for personalty. Depreciation methods: 200 or 150 percent declining-balance switching to straight-line. Recovery periods: 3, 5, 7, 10, 15, 20 years. Convention: half-year. Exhibit 8.4 Regular MACRS table for personalty. Depreciation method: 200 percent declining-balance switching to straight-line. Recovery periods: 3, 5, 7 years. Convention: mid-quarter. Exhibit 8.5 MACRS optional straight-line table for personalty. Depreciation method: straight-line. Recovery periods: 3, 5, 7, 10, 15, 20 years. Convention: half-year. Exhibit 8.6 Alternative minimum tax declining-balance table for personalty. Depreciation method: 150 percent declining-balance switching to straight-line. Recovery periods: 3, 5, 7, 9.5, 10, 12 years. Convention: half-year. Exhibit 8.7 Alternative depreciation system straight-line table for personalty. Depreciation method: straight-line. Recovery periods: 5, 10, 12 years. Exhibit 8.3 MACRS Accelerated Depreciation for Personal Property Assuming Half-Year Convention (Percentage Rates) For Property Placed in Service after December 31, 1986 Recovery 3-Year 5-Year 7-Year 10-Year 15-Year 20-Year Year (200% DB) (200% DB) (200% DB) (200% DB) (200% DB) (150% DB) ((150% DB) 1 33.33 20.00 14.29 10.00 5.00 3.750 2 44.45 32.00 24.49 18.00 9.50 7.219 3 14.81 19.20 17.49 14.40 8.55 6.677 4 7.41 11.52 12.49 11.52 7.70 6.177 5 11.52 8.93 9.22 6.93 5.713 6 5.76 8.92 7.37 6.23 5.285 7 8.93 6.55 5.90" 4.888 8 4.46 6.55 5.90 4.522 9 6.56 5.91 4.462* 10 6.55 5.90 4.461 11 3.28 5.91 4.462 12 5.90 4.461 13 5.91 4.462 14 5.90 4.461 15 5.91 4.462 16 2.95 4.461 17 4.462 18 4.461 19 4.462 20 4.461 21 2.231 *Switchover to straight-line depreciation. Exhibit 8.4 MACRS Accelerated Depreciation for Personal Property Assuming Mid-Quarter Convention (Percentage Rates) For Property Placed in Service after December 31, 1986 (Partial Table* ) 3-Year Recovery Year First Quarter Second Quarter Third Quarter Fourth Quarter 1 58.33 41.67 25.00 8.33 2. 27.78 38.89 50.00 61.11 5-Year First Quarter Second Quarter Recovery Year Third Quarter Fourth Quarter 1 35.00 25.00 15.00 5.00 2 26.00 30.00 34.00 38.00 7-Year Recovery Year First Quarter Second Quarter Third Quarter Fourth Quarter 1 25.00 17.85 10.71 3.57 2 21.43 23.47 25.51 27.55 Exhibit 8.5 MACRS Straight-Line Depreciation for Personal Property Assuming Half-Year Convention For Property Placed in Service after December 31, 1986 Other Recovery Years Last Recovery Year MACRS Class Years % % First Recovery Year Year % 3-year 16.67 2-3 33.33 4 16.67 10.00 2-5 20.00 6 10.00 5-year 7-year 7.14 2-7 14.29 8 7.14 10-year 5.00 2-10 10.00 11 5.00 3.33 2-15 6.67 16 3.33 15-year 20-year 2.50 2-20 5.00 21 2.50 Note: The last two rows of this table are used for qualified improvement property (15-year normal MACRS; 20-year ADS). 150% Exhibit 8.6 Alternative Minimum Tax: 150% Declining-Balance Assuming Half- Year Convention (Percentage Rates) For Property Placed in Service after December 31, 1986 (Partial Table") Recovery 3-Year 5-Year 7-Year 9.5-Year 10-Year 12-Year Year 150% 150% 150% 150% 150% 1 25.00 15.00 10.71 7.89 7.50 6.25 2 37.50 25.50 19.13 14.54 13.88 11.72 3 25.00 17.85 15.03 12.25 11.79 10.25 4 12.50 12.25 10.31 10.02 8.97 5 12.25 9.17" 8.74" 7.85 6 8.33 12.25 9.17 8.74 7.33** 7 12.25 9.17 8.74 7.33 8 6.13 9.17 8.74 7.33 9 9.17 8.74 7.33 10 9.16 8.74 7.33 11 437 7.32 12 7.33 13 3.66 16.66 * 16.66 * The figures in this table are taken from the official table that appears in Rev.Proc. 87-57, 1987-2 C.B. 687. Because of its length, the complete table is not presented. **Switchover to straight-line depreciation. Exhibit 8.7 ADS Straight-Line for Personal Property Assuming Half-Year Convention (Percentage Rates) For Property Placed in Service after December 31, 1986 (Partial Table) * Recovery Year 5-Year Class 10-Year Class 12-Year Class 1 10.00 5.00 4.17 2 20.00 10.00 8.33 3 20.00 10.00 8.33 4 10.00 8.33 5 20.00 20.00 10.00 10.00 8.33 6 10.00 8.33 7 10.00 8.34 8 10.00 8.33 9 10.00 8.34 10 10.00 8.33 11 5.00 8.34 12 8.33 13 4.17 Exhibit 8.8 MACRS Straight-Line Depreciation for Real Property Assuming Mid-Month Convention* (Percentage Rates) For Property Placed in Service after December 31, 1986: 27.5-Year Residential Real Property + Recovery The Applicable Percentage Is (Use the Column for the Month in the First Year the Property is placed in Service): Year(s) 1 2 3 5 9 10 12 1 3.485 3.1822.879 2.576 2.273 1.970 1.667 1.364 1,061 0.758 0455 0.152 2-18 3.636 3.636 3.636 3.636 3.636 3.636 3.636 3.636 3,636 3.636 3.636 3.636 19-27 3.637 3.637 3.637 3637 3.637 3.637 3.637 3.637 3.637 3.637 3637 3.637 28 1.970 2.273 2.576 2879 3.182 3.485 3.636 3.636 3.636 3.636 3.636 3.636 29 0.000 0.000 0.000 0.000 0.000 0.152 0.455 0.758 1,061 1.364 1.667 For Property Placed in Service after December 31, 1986, and before May 13, 1993: 31.S-Year Nonresidential Real Property Recovery The Applicable Percentage Is (Use the Column for the Month in the First Year the Property is placed in Service): Year(s) 1 2 5 6 9 10 11 12 1 3.042 2.778 2.513 2.249 1.984 1.720 1455 1.190 0.926 0.661 0.397 0.132 2-19 3.175 3.175 3.175 3.175 3.175 3.175 3.175 3.175 3.175 3.175 3.175 3.175 20-31 3.174 3.174 3.174 3.174 3.174 3.174 3.174 3.174 3.174 3.174 3.174 3.174 32 1.720 1.984 2.249 2.513 2.778 3.042 3.175 3.175 3.175 3.175 3.175 3.175 33 0.000 0.000 0.000 0.000 0.000 0.000 0.132 0.397 0.661 0.926 1.190 1.455 For Property Placed in Service after May 12, 1993: 39-Year Nonresidential Real Property Recovery The Applicable Percentage Is (Use the Column for the Month in the First Year the Property is placed in Service): Yearts) 3 5 7 10 12 1 2.461 2.247 2.033 1.819 1.605 1.391 1.177 0.963 0.749 0.535 0321 0.107 2-39 2564 2.564 2.564 2.564 2.564 2.564 2.564 2.564 2.564 2.564 2.564 2.564 40 0.107 0.321 0.535 0.749 0.963 1.177 1.391 1.605 1.819 2.033 2.247 2461 *The official tables contain a separate row for each year. For ease of presentation, certain years are grouped in these tables. In some instances, this will produce a difference of .001 for the last digit when compared with the official tables Exhibit 8.9 ADS Straight-Line for Real Property Assuming Mid-Month Convention (Percentage Rates) For Property Placed in Service after December 31, 2017; 30-Year Residential Rental Property Recovery Month Placed in Service Year 5 6 1 3.194 3.333 0.139 2 2.917 3.333 0.417 1 2-30 31 3 2.639 3.333 0.694 2083 1.806 2.361 3.333 0.972 7 1.528 3.333 1.806 1.250 3.333 2.083 0.972 3.333 2.361 10 0.694 3.333 2.639 11 0.417 3.333 2917 12 0.139 3.333 3.194 1.250 1.528 11 For Property Placed in Service after December 31, 1986; 40-Year Nonresidential Real Property Recovery Month Placed in Service Year 1 2 5 6 7 9 1 2.396 2.188 1.979 1.771 1.563 1.354 1.146 0.938 0.729 2-40 2.500 2.500 2.500 2.500 2.500 2.500 2.500 2.500 41 0.104 0.312 0.521 0.729 0.937 1.146 1.354 1.562 1.771 10 0.521 2.500 1.979 12 0.104 2.500 2.396 0313 2.500 2.187 2.500 *Also used for residential rental property placed in service before 2018
Step by Step Solution
There are 3 Steps involved in it

Get step-by-step solutions from verified subject matter experts