

Question: Problem 8-7 Modified Accelerated Cost Recovery System (MACRS) (LO 8.2) Calculate the following: Click here to access the various depreciation tables. If required, round your
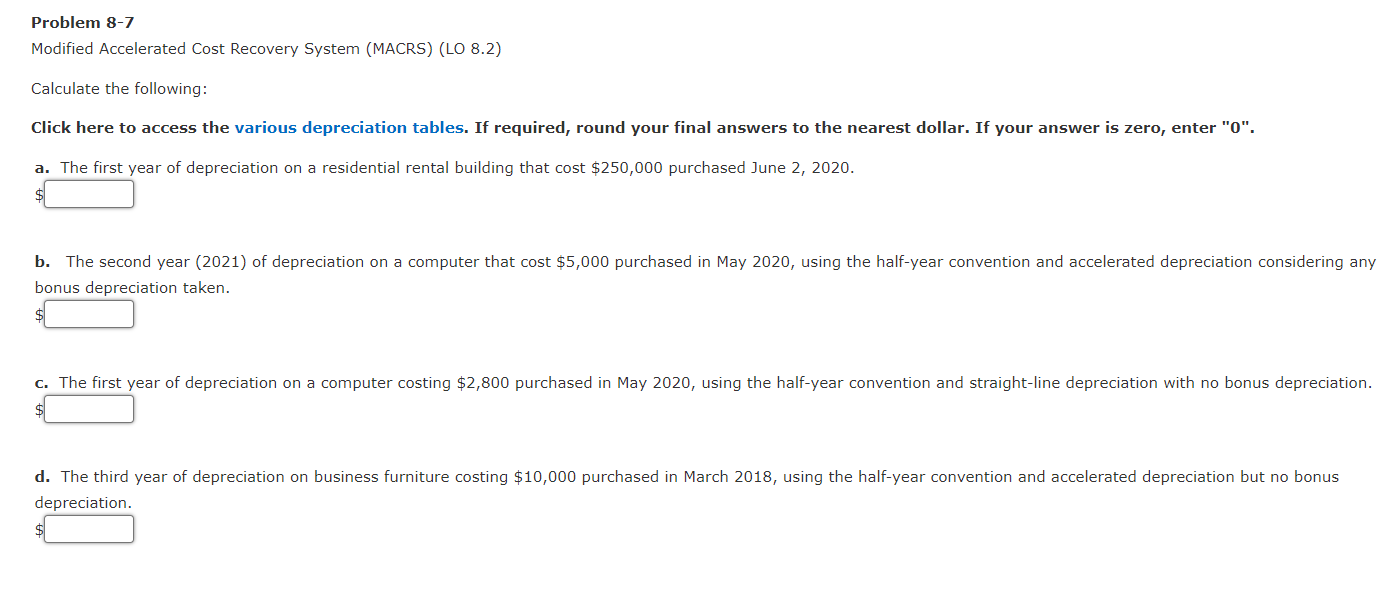
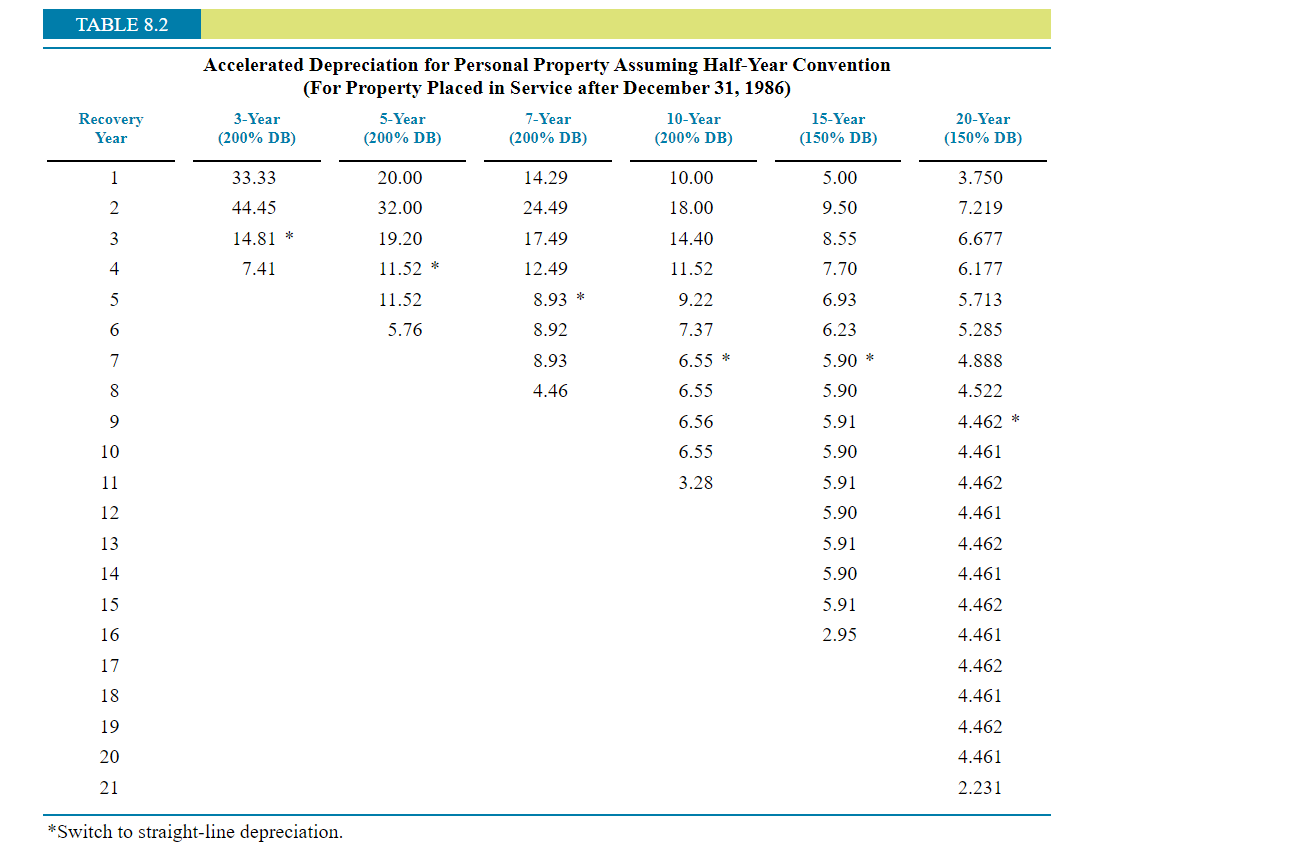
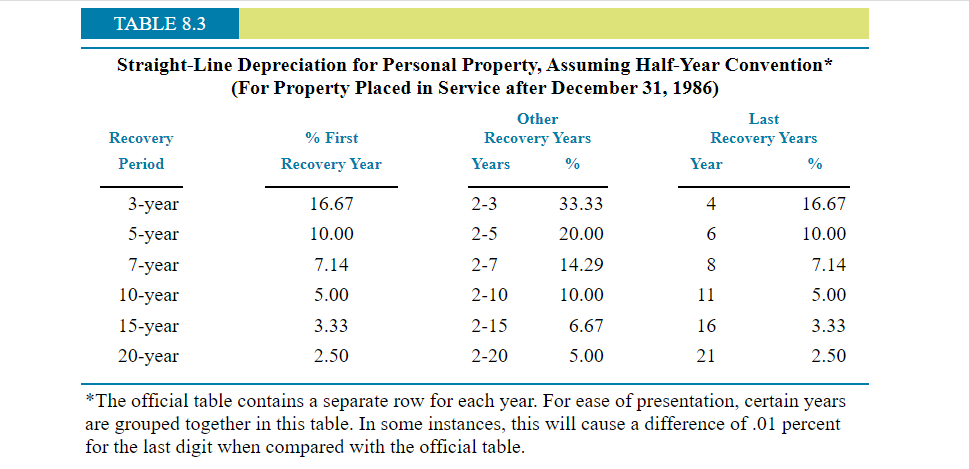
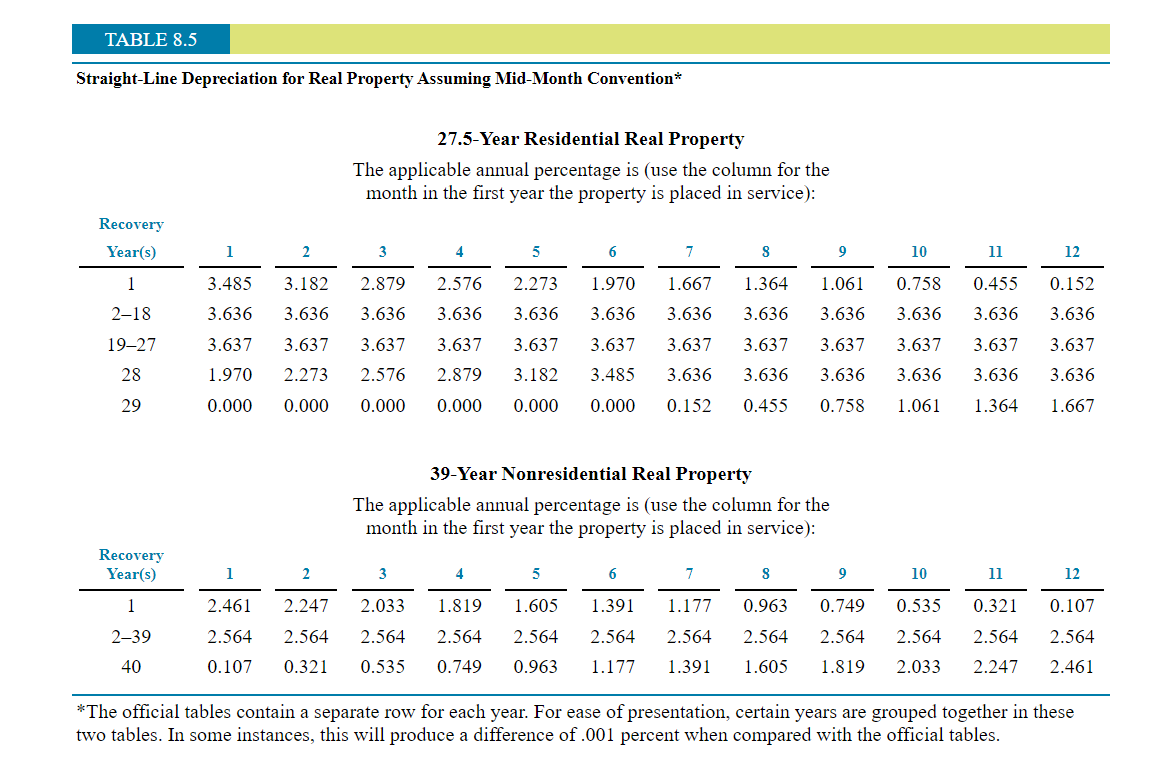
Problem 8-7 Modified Accelerated Cost Recovery System (MACRS) (LO 8.2) Calculate the following: Click here to access the various depreciation tables. If required, round your final answers to the nearest dollar. If your answer is zero, enter "0". a. The first year of depreciation on a residential rental building that cost $250,000 purchased June 2, 2020. b. The second year (2021) of depreciation on a computer that cost $5,000 purchased in May 2020, using the half-year convention and accelerated depreciation considering any bonus depreciation taken. c. The first year of depreciation on a computer costing $2,800 purchased in May 2020, using the half-year convention and straight-line depreciation with no bonus depreciation. d. The third year of depreciation on business furniture costing $10,000 purchased in March 2018, using the half-year convention and accelerated depreciation but no bonus depreciation. TABLE 8.2 Accelerated Depreciation for Personal Property Assuming Half-Year Convention (For Property Placed in Service after December 31, 1986) 3-Year 5-Year 7-Year 10-Year 15-Year (200% DB) (200% DB) (200% DB) (200% DB) (150% DB) Recovery Year 20-Year (150% DB) 1 33.33 14.29 10.00 5.00 3.750 20.00 32.00 2 44.45 24.49 18.00 9.50 7.219 3 14.81 * 19.20 17.49 14.40 8.55 6.677 4 7.41 11.52 * 12.49 11.52 7.70 6.177 5 11.52 8.93 * 9.22 6.93 5.713 5.285 6 5.76 8.92 7.37 6.23 7 8.93 6.55 * 5.90 * 4.888 8 4.46 6.55 5.90 4.522 9 6.56 4.462 * 5.91 5.90 10 6.55 4.461 11 3.28 5.91 4.462 12 5.90 4.461 13 5.91 14 5.90 4.462 4.461 4.462 4.461 5.91 15 16 2.95 17 4.462 18 4.461 19 4.462 20 4.461 21 2.231 *Switch to straight-line depreciation. TABLE 8.3 Straight-Line Depreciation for Personal Property, Assuming Half-Year Convention* (For Property Placed in Service after December 31, 1986) Other Last Recovery % First Recovery Years Recovery Years Period Recovery Year Years % Year % 2-3 33.33 4 16.67 16.67 10.00 2-5 20.00 6 10.00 7.14 2-7 14.29 8 7.14 3-year 5-year 7-year 10-year 15-year 20-year 5.00 2-10 10.00 11 5.00 3.33 2-15 6.67 16 3.33 2.50 2-20 5.00 21 2.50 *The official table contains a separate row for each year. For ease of presentation, certain years are grouped together in this table. In some instances, this will cause a difference of .01 percent for the last digit when compared with the official table. TABLE 8.5 Straight-Line Depreciation for Real Property Assuming Mid-Month Convention* 27.5-Year Residential Real Property The applicable annual percentage is (use the column for the month in the first year the property is placed in service): Recovery Year(s) 1 2 3 4 7 8 9 10 11 12 1 3.485 3.182 1.970 1.364 0.152 2.273 3.636 2.879 3.636 3.637 1.667 3.636 2.576 3.636 3.637 2-18 0.758 3.636 3.636 0.455 3.636 3.636 1.061 3.636 3.637 3.636 3.636 3.636 19-27 3.637 3.637 3.637 3.637 3.637 3.637 3.637 3.637 3.636 3.637 3.636 28 1.970 2.273 2.576 2.879 3.182 3.485 3.636 3.636 3.636 3.636 29 0.000 0.000 0.000 0.000 0.000 0.000 0.152 0.455 0.758 1.061 1.364 1.667 39-Year Nonresidential Real Property The applicable annual percentage is (use the column for the month in the first year the property is placed in service): Recovery Year(s) 3 4 9 10 11 12 1 2.461 2.247 2.033 1.819 1.605 1.391 1.177 0.963 0.749 0.535 0.321 0.107 2-39 2.564 2.564 2.564 2.564 2.564 2.564 2.564 2.564 2.564 2.564 2.564 2.564 0.107 40 0.321 0.535 0.749 0.963 1.177 1.391 1.605 1.819 2.033 2.247 2.461 *The official tables contain a separate row for each year. For ease of presentation, certain years are grouped together in these two tables. In some instances, this will produce a difference of .001 percent when compared with the official tables
Step by Step Solution
There are 3 Steps involved in it

Get step-by-step solutions from verified subject matter experts