

Question: Problem 9 (2+ 2+2+2+2= 10 marks} In a study of variables that affect productivity in the retail grocery trade, the researcher uses value added per
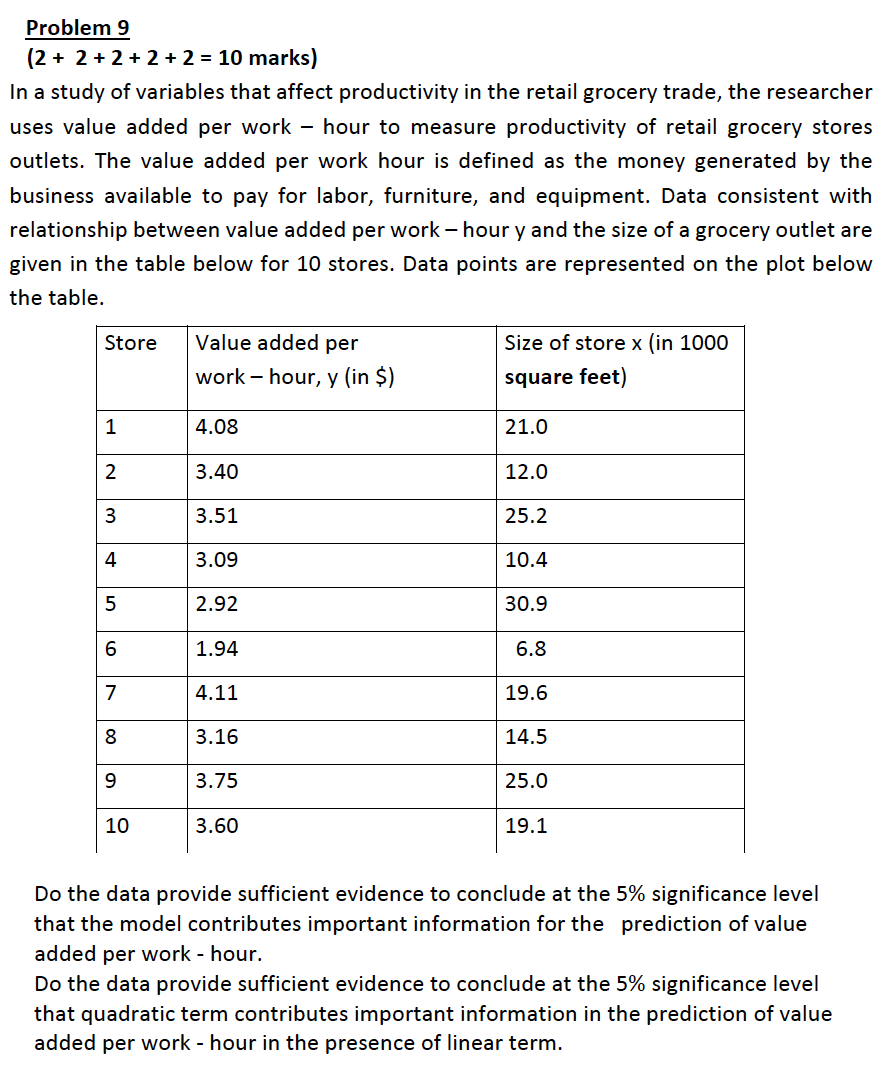

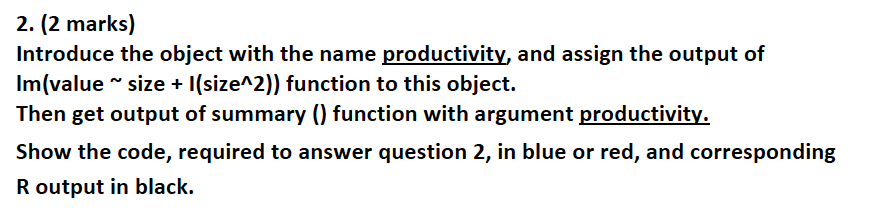
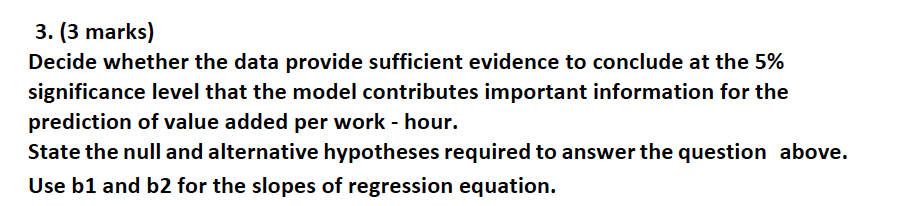
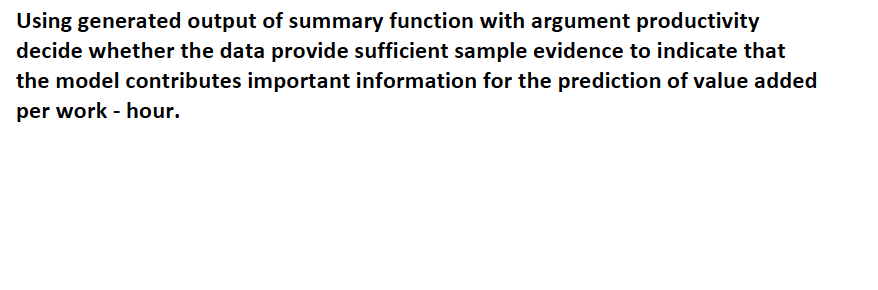

Problem 9 (2+ 2+2+2+2= 10 marks} In a study of variables that affect productivity in the retail grocery trade, the researcher uses value added per work hour to measure productivity of retail grocery stores outlets. The value added per work hour is defined as the money generated by the business available to pay for labor, furniture, and equipment. Data consistent with relationship between value added per work hour y and the size of a grocery outlet are given in the table below for 10 stores. Data points are represented on the plot below the table. Store Value added per Size of store x {in 1000 workhour, y{in 5) square feet) 1 4.08 21.0 2 3.40 12.0 3 3.51 25.2 4 3.09 10.4 5 2.92 30.9 6 1.94 6.8 7 4.11 19.6 8 3.16 14.5 9 3.75 25.0 10 3.60 19.1 Do the data provide sufficient evidence to conclude at the 5% significance level that the model contributes important information for the prediction of value added per work - hour. Do the data provide sufficient evidence to conclude at the 5% significance level that quadratic term contributes important information in the prediction of value added per work - hour in the presence of linear term. For full solution answer questions 1, 2, 3, 4, and 5. 1. (2 marks) Introduce the vectors size, and value2. [2 marks) Introduce the object with the name productivity, and assign the output of Imhralue "' size + I[size"2}) function to this object. Then get output of summary () function with argument productivity. Show the code, required to answer question 2, in blue or red, and corresponding R output in black. 3. [3 marks) Decide whether the data provide sufficient evidence to conclude at the 5% significance level that the model contributes important information for the prediction of value added per work - hour. State the null and alternative hypotheses required to answer the question above. Use b1 and b2 for the slopes of regression equation. Using generated output of summary function with argument productivity decide whether the data provide sufficient sample evidence to indicate that the model contributes important information for the prediction of value added per work - hour. 4.(3 marks) Decide whether the data provide sufficient evidence to conclude at the 5% significance level that quadratic term contributes important information in the prediction of value added per work - hour in the presence of linear term. State the null and alternative hypotheses required to answer the question above. Use b2 for the slope of regression equation. Using generated output of summary function with argument productivity decide whether the data provide sufficient evidence to conclude at the 5% significance level that quadratic term contributes important information in the prediction of value added per work - hour in the presence of linear term. 5. [3 marks) Use R to construct the plot of quadratic regression curve with the title "Fitted line plot\". Write the code required to produce the plot
Step by Step Solution
There are 3 Steps involved in it

Get step-by-step solutions from verified subject matter experts