

Question: Problem 9: Consider the following daily prices for a security: time 0 1 price 50 51 50 52 2 3 53 4 5 52

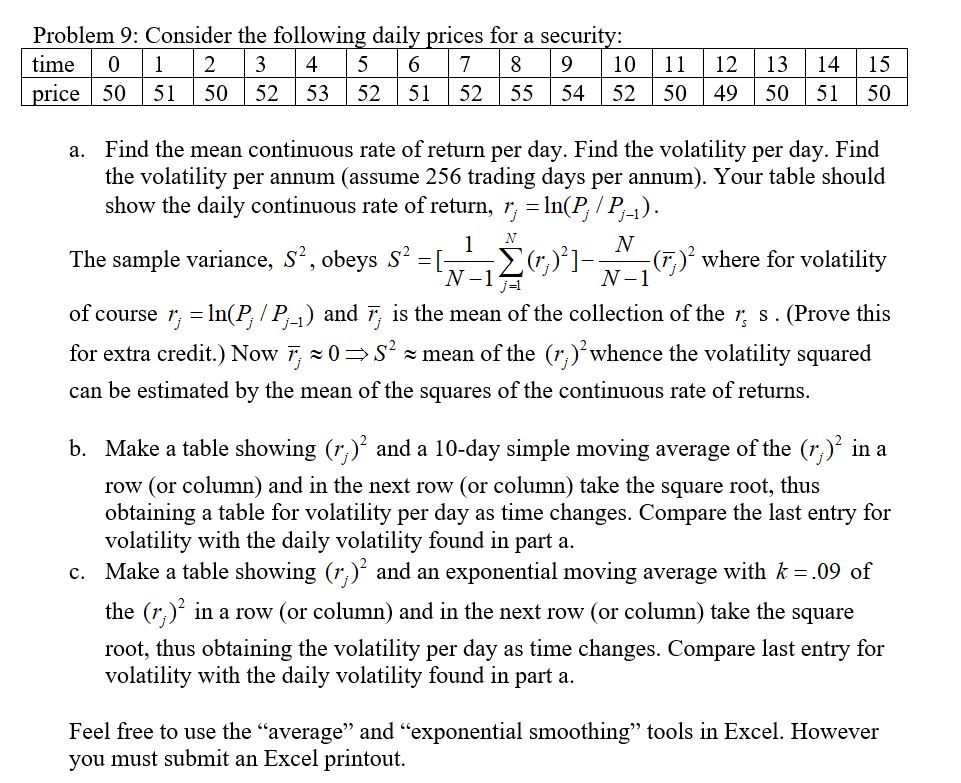
Problem 9: Consider the following daily prices for a security: time 0 1 price 50 51 50 52 2 3 53 4 5 52 6 7 8 9 10 51 52 55 54 52 11 12 13 14 15 50 49 50 51 50 a. Find the mean continuous rate of return per day. Find the volatility per day. Find the volatility per annum (assume 256 trading days per annum). Your table should show the daily continuous rate of return, r = ln(P/P-1). The sample variance, S, obeys S = of course r; = ln(P; | P) for extra credit.) Now F; N 1 N-1 N 1- (F) where for volatility j=1 N-1 and 7; is the mean of the collection of the r; s. (Prove this 0>> S mean of the (r;) whence the volatility squared can be estimated by the mean of the squares of the continuous rate of returns. b. Make a table showing (r;) and a 10-day simple moving average of the (7;) in a row (or column) and in the next row (or column) take the square root, thus obtaining a table for volatility per day as time changes. Compare the last entry for volatility with the daily volatility found in part a. c. Make a table showing (r) and an exponential moving average with k = .09 of the (r) in a row (or column) and in the next row (or column) take the square root, thus obtaining the volatility per day as time changes. Compare last entry for volatility with the daily volatility found in part a. Feel free to use the "average" and "exponential smoothing" tools in Excel. However you must submit an Excel printout.
Step by Step Solution
There are 3 Steps involved in it

Get step-by-step solutions from verified subject matter experts