

Question: problem 9. Part 1-3 Intro Return statistics for Visa stock, the S&P 500 and the risk-free asset, Treasury bills, are given below: A D B
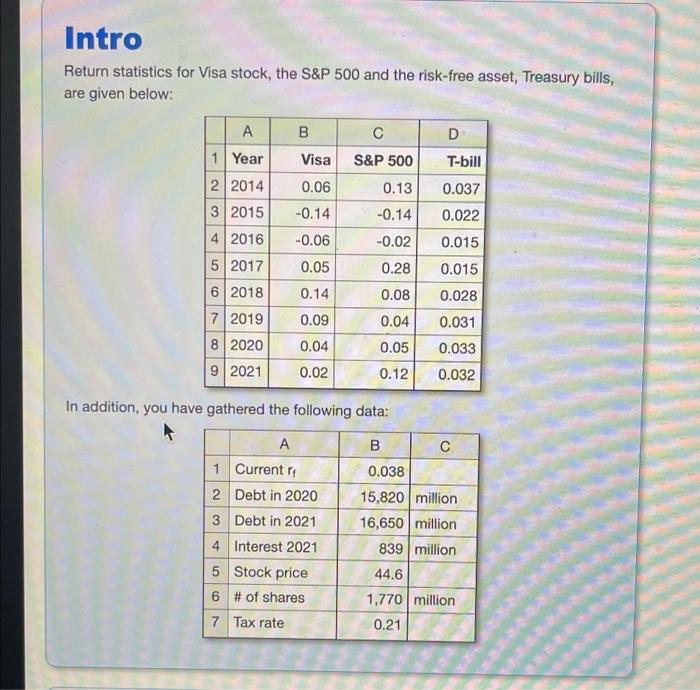
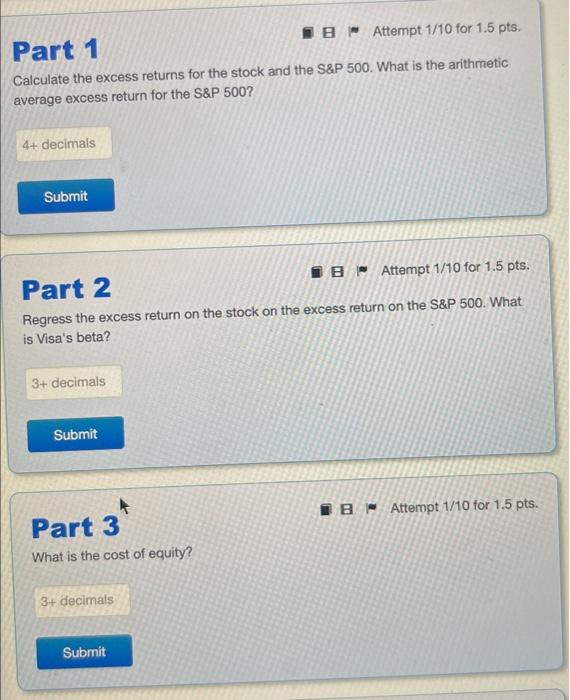
Intro Return statistics for Visa stock, the S&P 500 and the risk-free asset, Treasury bills, are given below: A D B Visa S&P 500 1 Year T-bill 2 2014 0.06 0.037 0.13 -0.14 -0.14 0.022 3 2015 4 2016 -0.06 -0.02 0.015 5 2017 0.05 0.015 0.28 0.08 6 2018 0.14 0.028 72019 0.09 0.031 0.04 0.05 8 2020 0.033 0.04 0.02 9 2021 0.12 0.032 In addition, you have gathered the following data: A B 1 Current 2 Debt in 2020 3 Debt in 2021 4 Interest 2021 5 Stock price 6 # of shares 0.038 15,820 million 16,650 million 839 million 44.6 1,770 million 0.21 7 Tax rate Part 1 IS Attempt 1/10 for 1.5 pts. Calculate the excess returns for the stock and the S&P 500. What is the arithmetic average excess return for the S&P 500? 4+ decimals Submit Part 2 IB Attempt 1/10 for 1.5 pts. Regress the excess return on the stock on the excess return on the S&P 500. What is Visa's beta? 3+ decimals Submit IB Attempt 1/10 for 1.5 pts. Part 3 What is the cost of equity? 3+ decimals Submit
Step by Step Solution
There are 3 Steps involved in it

Get step-by-step solutions from verified subject matter experts