

Question: Problem 9-13 (algorithmic) Question Help * International Fischer Forecasts. Use the tablecontaining economic, financial, and business indicators to answer the following questions. Assuming International Fischer
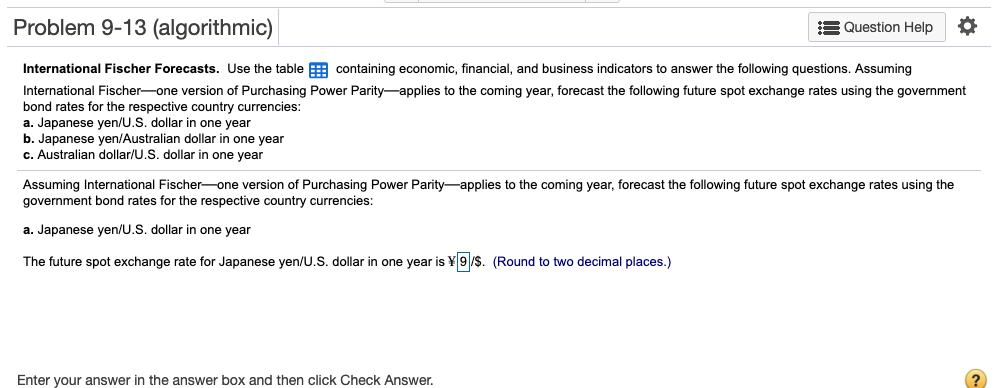
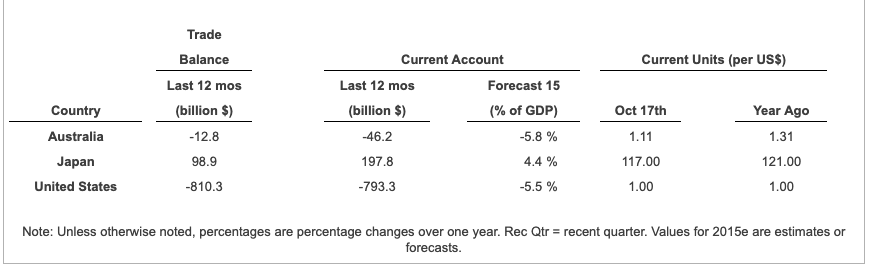
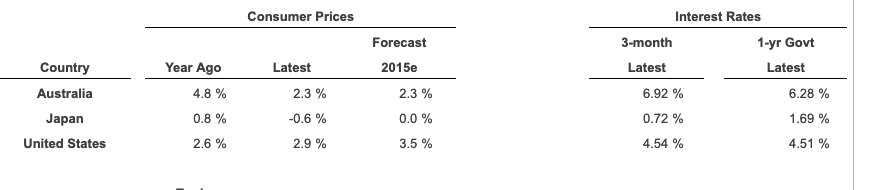
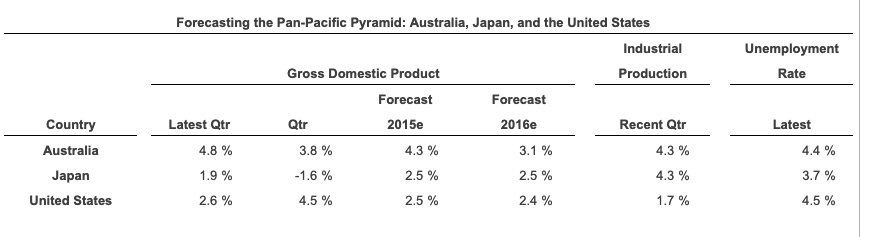
Problem 9-13 (algorithmic) Question Help * International Fischer Forecasts. Use the tablecontaining economic, financial, and business indicators to answer the following questions. Assuming International Fischer one version of Purchasing Power Parity -applies to the coming year, forecast the following future spot exchange rates using the government bond rates for the respective country currencies a. Japanese yen/U.S. dollar in one year b. Japanese yen/Australian dollar in one year c. Australian dollar/U.S. dollar in one year Assuming International Fischer one version of Purchasing Power Parityapplies to the coming year, forecast the following future spot exchange rates using the government bond rates for the respective country currencies: a. Japanese yen/U.S. dollar in one year The future spot exchange rate for Japanese yen/U.S. dollar in one year is Y9/S. (Round to two decimal places.) Enter your answer in the answer box and then click Check Answer Trade Balance Last 12 mos (billion $) -12.8 98.9 -810.3 Current Account Current Units (per US$) Country Australia Japan United States Last 12 mos (billion $) 46.2 197.8 793.3 Forecast 15 (% of GDP) 5.8 % AA% -5.5 % Oct 17th 1.11 117.00 1.00 Year Ago 1.31 121.00 1.00 Note: Unless otherwise noted, percentages are percentage changes over one year. Rec Qtr-recent quarter. Values for 2015e are estimates or forecasts Consumer Prices Interest Rates Forecast 3-month 1-yr Govt 2015e Country Australia Japan United States Year Ago Latest Latest Latest 4.8 % 0.8 % 26% 2.3% -0.6 % 2.9 % 2.3% 0.0 % 3.5 % 6.92 % 072% 4.54 % 6.28 % 1.69 % 4.51 % Forecasting the Pan-Pacific Pyramid: Australia, Japan, and the United States Industrial Unemployment Production Rate Gross Domestic Product Forecast Forecast Latest Recent Qtr 4.3 % 4.3 % 1.7% Qtr 2015e 2016e Country Australia Japan United States Latest Qtr 4.8 % 1.9 % 2.6% 4.3 % 25% 25% 3.1% 25% 2.4% 4.4% 37 % 45% 3.8 % 45% Problem 9-13 (algorithmic) Question Help * International Fischer Forecasts. Use the tablecontaining economic, financial, and business indicators to answer the following questions. Assuming International Fischer one version of Purchasing Power Parity -applies to the coming year, forecast the following future spot exchange rates using the government bond rates for the respective country currencies a. Japanese yen/U.S. dollar in one year b. Japanese yen/Australian dollar in one year c. Australian dollar/U.S. dollar in one year Assuming International Fischer one version of Purchasing Power Parityapplies to the coming year, forecast the following future spot exchange rates using the government bond rates for the respective country currencies: a. Japanese yen/U.S. dollar in one year The future spot exchange rate for Japanese yen/U.S. dollar in one year is Y9/S. (Round to two decimal places.) Enter your answer in the answer box and then click Check Answer Trade Balance Last 12 mos (billion $) -12.8 98.9 -810.3 Current Account Current Units (per US$) Country Australia Japan United States Last 12 mos (billion $) 46.2 197.8 793.3 Forecast 15 (% of GDP) 5.8 % AA% -5.5 % Oct 17th 1.11 117.00 1.00 Year Ago 1.31 121.00 1.00 Note: Unless otherwise noted, percentages are percentage changes over one year. Rec Qtr-recent quarter. Values for 2015e are estimates or forecasts Consumer Prices Interest Rates Forecast 3-month 1-yr Govt 2015e Country Australia Japan United States Year Ago Latest Latest Latest 4.8 % 0.8 % 26% 2.3% -0.6 % 2.9 % 2.3% 0.0 % 3.5 % 6.92 % 072% 4.54 % 6.28 % 1.69 % 4.51 % Forecasting the Pan-Pacific Pyramid: Australia, Japan, and the United States Industrial Unemployment Production Rate Gross Domestic Product Forecast Forecast Latest Recent Qtr 4.3 % 4.3 % 1.7% Qtr 2015e 2016e Country Australia Japan United States Latest Qtr 4.8 % 1.9 % 2.6% 4.3 % 25% 25% 3.1% 25% 2.4% 4.4% 37 % 45% 3.8 % 45%
Step by Step Solution
There are 3 Steps involved in it

Get step-by-step solutions from verified subject matter experts