

Question: Problem A construction company is planning their projects for the year 2020. The company is considering the construction of a certain number of 5,000 m2
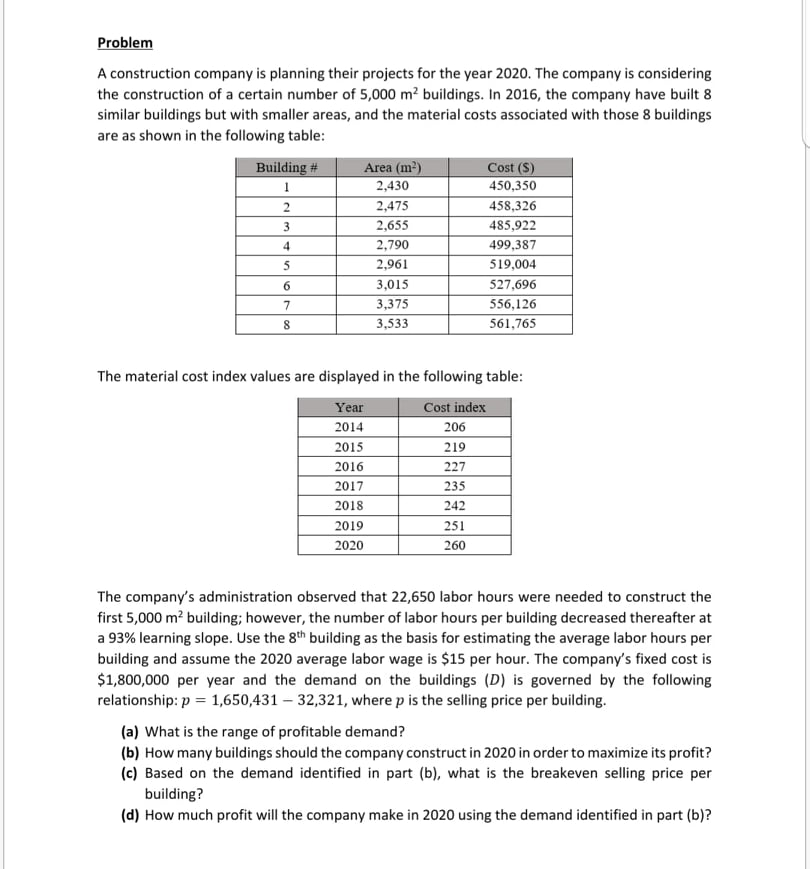
Problem A construction company is planning their projects for the year 2020. The company is considering the construction of a certain number of 5,000 m2 buildings. In 2016, the company have built 8 similar buildings but with smaller areas, and the material costs associated with those 8 buildings are as shown in the following table: Building # Area (m2) Cost (S) 2,430 450,350 2 2,475 458,326 2,655 485,922 2,790 499,387 2,961 519,004 3,015 527,696 3,375 556,126 3,533 561,765 3 4 5 6 7 8 The material cost index values are displayed in the following table: Year Cost index 2014 206 2015 219 2016 227 2017 235 2018 242 2019 251 2020 260 The company's administration observed that 22,650 labor hours were needed to construct the first 5,000 m building; however, the number of labor hours per building decreased thereafter at a 93% learning slope. Use the 8th building as the basis for estimating the average labor hours per building and assume the 2020 average labor wage is $15 per hour. The company's fixed cost is $1,800,000 per year and the demand on the buildings (D) is governed by the following relationship: p = 1,650,431 32,321, where p is the selling price per building. (a) What is the range of profitable demand? (b) How many buildings should the company construct in 2020 in order to maximize its profit? (c) Based on the demand identified in part (b), what is the breakeven selling price per building? (d) How much profit will the company make in 2020 using the demand identified in part (b)? Problem A construction company is planning their projects for the year 2020. The company is considering the construction of a certain number of 5,000 m2 buildings. In 2016, the company have built 8 similar buildings but with smaller areas, and the material costs associated with those 8 buildings are as shown in the following table: Building # Area (m2) Cost (S) 2,430 450,350 2 2,475 458,326 2,655 485,922 2,790 499,387 2,961 519,004 3,015 527,696 3,375 556,126 3,533 561,765 3 4 5 6 7 8 The material cost index values are displayed in the following table: Year Cost index 2014 206 2015 219 2016 227 2017 235 2018 242 2019 251 2020 260 The company's administration observed that 22,650 labor hours were needed to construct the first 5,000 m building; however, the number of labor hours per building decreased thereafter at a 93% learning slope. Use the 8th building as the basis for estimating the average labor hours per building and assume the 2020 average labor wage is $15 per hour. The company's fixed cost is $1,800,000 per year and the demand on the buildings (D) is governed by the following relationship: p = 1,650,431 32,321, where p is the selling price per building. (a) What is the range of profitable demand? (b) How many buildings should the company construct in 2020 in order to maximize its profit? (c) Based on the demand identified in part (b), what is the breakeven selling price per building? (d) How much profit will the company make in 2020 using the demand identified in part (b)
Step by Step Solution
There are 3 Steps involved in it

Get step-by-step solutions from verified subject matter experts