

Question: Problem A) Simple Linear Regression Use each variable (state anxiety, trait anxiety, and curiosity) to predict depression individually. Note: you should run three different regressions.
Problem A) Simple Linear Regression
- Use each variable (state anxiety, trait anxiety, and curiosity) to predict depression individually. Note: you should run three different regressions.
- Report the results of each regression in paragraphstyle and write each regression line.
| Model Fit Measures | |||||||||||||
|---|---|---|---|---|---|---|---|---|---|---|---|---|---|
| Overall Model Test | |||||||||||||
| Model | R | R | F | df1 | df2 | p | |||||||
| 1 | 0.520 | 0.271 | 36.3 | 1 | 98 | .001 | |||||||
| Model Coefficients - Depression | |||||||||||
|---|---|---|---|---|---|---|---|---|---|---|---|
| Predictor | Estimate | SE | t | p | Stand. Estimate | ||||||
| Intercept | 12.866 | 1.4941 | 8.61 | .001 | |||||||
| State_Anxiety | 0.239 | 0.0397 | 6.03 | .001 | 0.520 | ||||||
| Model Fit Measures | |||||||||||||
|---|---|---|---|---|---|---|---|---|---|---|---|---|---|
| Overall Model Test | |||||||||||||
| Model | R | R | F | df1 | df2 | p | |||||||
| 1 | 0.498 | 0.248 | 32.2 | 1 | 98 | .001 | |||||||
| Model Coefficients - Depression | |||||||||||
|---|---|---|---|---|---|---|---|---|---|---|---|
| Predictor | Estimate | SE | t | p | Stand. Estimate | ||||||
| Intercept | 11.685 | 1.7807 | 6.56 | .001 | |||||||
| Trait_Anxiety | 0.254 | 0.0447 | 5.68 | .001 | 0.498 | ||||||
| Model Fit Measures | ||||||||||
|---|---|---|---|---|---|---|---|---|---|---|
| Overall Model Test | ||||||||||
| Model | R | R | F | df1 | df2 | p | ||||
| 1 | 0.143 | 0.0204 | 2.04 | 1 | 98 | 0.156 | ||||
| Model Coefficients - Depression | |||||||||||
|---|---|---|---|---|---|---|---|---|---|---|---|
| Predictor | Estimate | SE | t | p | Stand. Estimate | ||||||
| Intercept | 27.135 | 4.005 | 6.77 | .001 | |||||||
| Curiosity | -0.202 | 0.142 | -1.43 | 0.156 | -0.143 | ||||||
Problem B) Multiple Linear Regression
- Conduct a multiple regression using all five variables together (state anxiety, trait anxiety, happiness, anger, curiosity) to predict depression scores.
- Report the results in a paragraph style and write the regression line.
- Finally, using multiple regression, make a regression table as was demonstrated in class.
| Model Fit Measures | |||||||||||||
|---|---|---|---|---|---|---|---|---|---|---|---|---|---|
| Overall Model Test | |||||||||||||
| Model | R | R | F | df1 | df2 | p | |||||||
| 1 | 0.665 | 0.442 | 14.9 | 5 | 94 | .001 | |||||||
| Model Coefficients - Depression | ||||||||||
|---|---|---|---|---|---|---|---|---|---|---|
| Predictor | Estimate | SE | t | p | Stand. Estimate | |||||
| Intercept | 7.4307 | 4.3722 | 1.700 | 0.093 | ||||||
| State_Anxiety | 0.1254 | 0.0558 | 2.246 | 0.027 | 0.2728 | |||||
| Trait_Anxiety | 0.0703 | 0.0646 | 1.089 | 0.279 | 0.1377 | |||||
| Happiness | 0.0956 | 0.0427 | 2.242 | 0.027 | 0.2271 | |||||
| Anger | 0.2131 | 0.0841 | 2.533 | 0.013 | 0.2400 | |||||
| Curiosity | -0.0208 | 0.1208 | -0.172 | 0.863 | -0.0147 | |||||
Problem C) Moderation
- Test if the relationship between hours worked per week predicting Current GPA is moderated by Interdependent motives.
- Report the results in paragraphstyle using appropriate tables and figures as needed.
| Moderation Estimates | ||||||
|---|---|---|---|---|---|---|
| 95% Confidence Interval | ||||||
| Estimate | SE | Lower | Upper | Z | p | |
| HOURS_WORK | 0.04119 | 0.00151 | 0.03822 | 0.04415 | 27.22 | .001 |
| Interdependent_Motives | 0.06239 | 0.01095 | 0.04094 | 0.08385 | 5.70 | .001 |
| HOURS_WORK ? Interdependent_Motives | -0.00332 | 0.00105 | -0.00538 | -0.00127 | -3.17 | 0.002 |
| Simple Slope Estimates | |||||||
|---|---|---|---|---|---|---|---|
| 95% Confidence Interval | |||||||
| Estimate | SE | Lower | Upper | Z | p | ||
| Average | 0.0412 | 0.00154 | 0.0382 | 0.0442 | 26.8 | .001 | |
| Low (-1SD) | 0.0460 | 0.00207 | 0.0420 | 0.0501 | 22.3 | .001 | |
| High (+1SD) | 0.0363 | 0.00228 | 0.0319 | 0.0408 | 16.0 | .001 | |
| Note.shows the effect of the predictor (HOURS_WORK) on the dependent variable (CurrentGPA) at different levels of the moderator (Interdependent_Motives) | |||||||
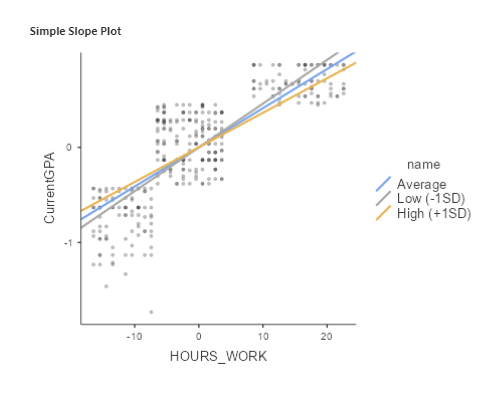
Simple Slope Plot name CurrentGPA Average Low (-1SD) High (+1SD) -1 -10 0 10 20 HOURS WORK\f
Step by Step Solution
There are 3 Steps involved in it
1 Expert Approved Answer
Step: 1 Unlock

Question Has Been Solved by an Expert!
Get step-by-step solutions from verified subject matter experts
Step: 2 Unlock
Step: 3 Unlock